IMX has formed what looks like an inverted right-angle triangle—and that could mean big moves are next.
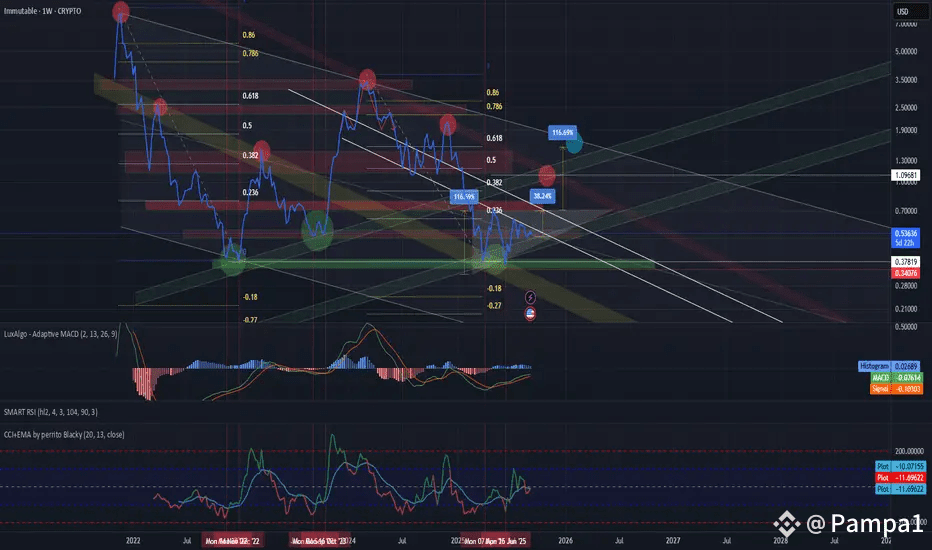
I spotted a chart setup that’s hard to ignore. On both the 3-day and weekly frames, IMX appears caught in a descending channel, and a potential inverted triangle with a right angle is forming near its lower edge . Every past reversal lined up with this yellow channel—green circles mark each one, and guess what? We’re right at another of those points .
Fibonacci is lining up too—price is hovering around the 0.5 to 0.618 retracement zones, just like in the previous cycle. MACD registers signs of accumulation. Meanwhile, the CCI suggests we’re nowhere near overbought .
I hesitate to say this is obvious—but it’s compelling. If IMX breaks up from that triangle, we could see a run toward the upper channel boundary. If it fails, downside is on the table. Either way, this chart is a setup worth watching closely.
