Ethereum’s 2025 price action is starting to rhyme with history — and if this chart holds, we’re staring down a monster Q4 rally.
🔎 What the Chart Shows
📊 Black line = ETH 2025 actual price so far
🟡 Colored lines = historical paths from 2020–2024
🔴 Red overlay = average trend across past cycles
The kicker? ETH’s 2025 trajectory is hugging the historical average almost perfectly.
📈 The Setup Into Year-End
✅ ETH has survived the Q1–Q2 correction just like past cycles
✅ Since July, ETH has flipped back into growth mode
🔮 If history continues to rhyme, ETH could finish 2025 near $6K–$7K+
🌐 Why This Cycle Is Different
Institutional Ethereum ETFs are pulling in billions 📥
Layer 2 ecosystems (Base, Arbitrum, Optimism) exploding in adoption 🔗
ETH staking yield remains the ultimate crypto bond for institutions 🏦
Merge + deflationary supply 🔥 continues to cut issuance
⚡ Final Take
The data doesn’t lie: Ethereum’s 2025 path is tracking its strongest historical rallies. If ETH clears $4K in September–October, the probability of a parabolic run into $6K–$7K+ by year-end skyrockets.
👉 The charts are whispering what smart money already kn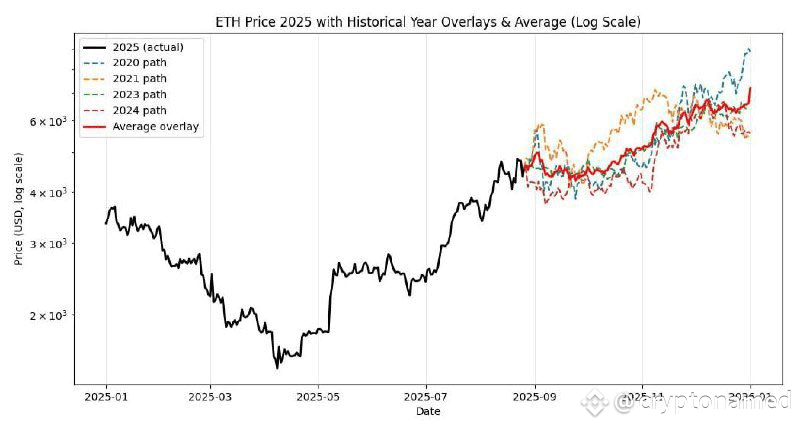 ows. Are you positioned?

