This is not a 'motivational speech' or 'theoretical tutorial', but a rolling position strategy I tested with 10 accounts over the past 3 months, with the highest monthly return of 2100%.
But the liquidation rate exceeds 80%.
If you just want to mindlessly follow trades, you can close the page now;
But if you are willing to strictly execute the strategy, you may become one of the 20% survivors.
Core logic: The 'compound interest bomb' of rolling positions.
The essence of rolling positions is not 'constantly increasing positions', but 'increasing positions with profit and stopping losses with loss', using the compound interest effect to let profits run.
But 90% of people die in these 3 pits:
1. Do not dare to increase positions when profitable (missed explosive market).
2. Stubbornly holding losses (eventually leading to liquidation)
3. Wrong asset selection (poor liquidity, spikes)
The core of my strategy: "3x leverage + dynamic take profit + hedging protection", which neither lets profits retreat nor misses out on trending markets.
Asset selection: BTC/ETH exchange rate hedging (stable volatility, not prone to spikes)
Position opening strategy:
Open a 3x long position when BTC retreats to key support levels (like 60,000)
After the first profit of 20% (200U), roll 50% of the profit into the next trade
Stop loss: close positions immediately if it falls below the previous low (keep losses within 10%)
Key details:
Only operate between 1-3 AM Beijing time (best liquidity, less manipulation)
Use limit orders + take profit and stop loss to avoid slippage
Stage 2: 3000U→8000U (10-12 days)
Asset upgrade: high-volatility altcoins (like SOL, ORDI)
Rolling position technique:
Wait for a breakout above key resistance levels, then chase with 3x leverage
After a profit of 30%, take partial profits, and set a trailing stop for the remaining position
If there are two consecutive losing trades, stop trading for the day
Risk control:
Absolutely do not touch low liquidity altcoins (easy to get wrecked)
After each trade, withdraw 10% of profits to a cold wallet (to prevent overtrading)
Stage 3: 8000U→20000U (final sprint)
Ultimate strategy: Contract + Spot combination punch
70% of funds used for BTC/ETH trend trades (5x leverage, capturing large swings)
30% of funds should be allocated to low-market-cap high-potential coins (like certain exchange IEO coins, specifics can be discussed privately)
Set automated take profit (lock in partial profits every 10% increase)
The last line of defense:
When total funds reach 15,000U **, withdraw the principal and only use profits for speculation
If you encounter extreme market conditions, immediately switch to stablecoin arbitrage (annualized 20%+, for survival)
Why do 90% of people fail?
1. Emotional loss of control (profit expansion, stubbornly holding losses)
2. Leverage abuse (blindly opening 10x, 20x)
3. Ignore the time window (missing the best trading period)
My solution:
Use quantitative trading robots for automatic execution (to avoid manual operation errors)
Set strict stop-loss discipline (stop trading if daily losses exceed 10%)
Regularly withdraw profits (to prevent ‘paper wealth’)
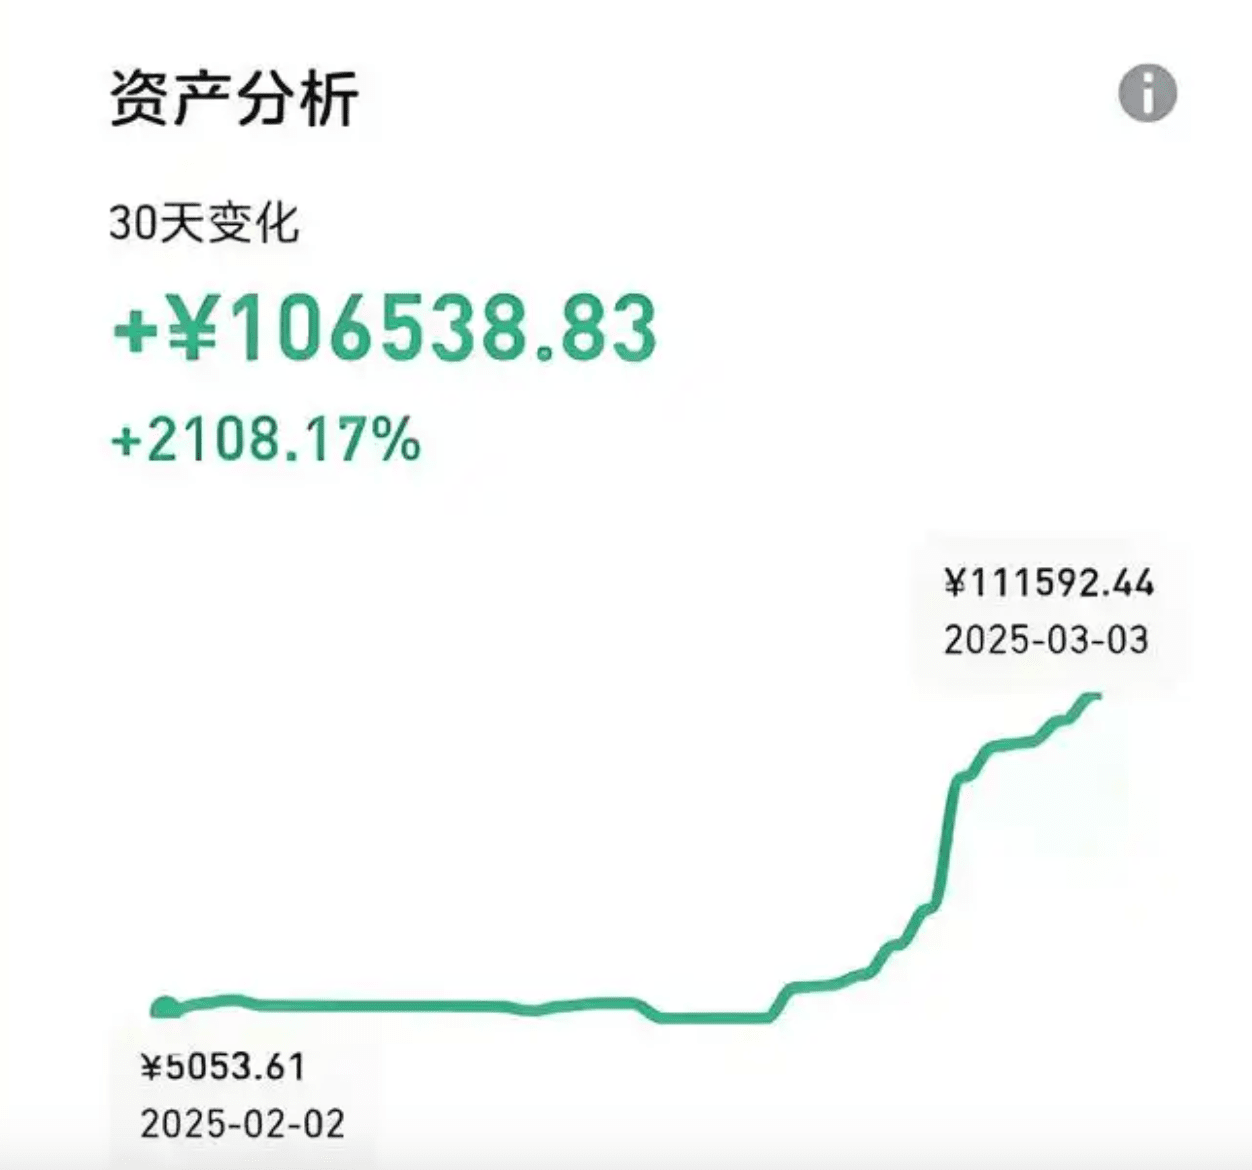
This method is also one that I have personally tested: from February to March 2025, in one month, I made 100,000 from 5,000! A profit increase of 2108.17%!
The leverage at which crypto contracts are opened without liquidation depends on the following conditions:
1. Your risk preference
2. The cryptocurrency for the opened contract
3. The size of the contract's funds
4. Are you doing simple interest or compound interest
5. Assess the magnitude of the market.
Next, I will introduce two position management methods!
1. Left-side position management
1) Do not exhaust all your bullets in one go; buy in batches!!!
2) You can divide your funds into several parts. When unsure of the bottom, buying in batches is the most suitable method to average the cost price!!!
(3) The bottom of the replenishment should be handled flexibly according to market changes; do not replenish too frequently, as it negatively affects the averaging of coin prices. An advance of 20%, 30%, or 50% is suitable for aggressive investors who are keen on bottom fishing!!!
(4) The initial capital for entry is relatively small; if the coin price does not rise and continues to fall, gradually increase the position, and the proportion of the increase becomes larger, thereby averaging the cost. This method has relatively low initial risk, and the higher the funnel, the more considerable the profit!!
2. Right-side position management
(1) Buy 1: When the 5-day moving average crosses above the 10-day moving average, add 30% to the position!!
(2) Buy 2: If the price effectively breaks above the lifeline, continue to add 30% to the position when it pulls back to the lifeline, ensuring that the total position reaches 60% at the early stages of the uptrend!
(3) Buy 3: When breaking the neckline or other important resistance levels, if it pulls back and stabilizes again, it indicates a reversal pattern is established, add 20% more. The total position should reach 80%, hold the coins and wait for the rise!!
(4) Buy 4: When the price appears above the lifeline again with a golden cross between the 5-day and 10-day moving averages, it is a typical signal to accelerate upward. At this time, the remaining 20% of the position should also be bought in time to maximize profits!!!
Foolproof trading method, simple and practical, even if you are a new investor, you can operate easily, with an accuracy rate of over 80%. Both buying and selling in the crypto market can be done using this method!
1. The selected coin must be in an uptrend. Of course, it can also be in a consolidation phase, but it must not be in a downtrend or have moving averages that are all opening downwards.
2. Divide the funds into three equal parts. When the price breaks above the 5-day moving average, buy lightly with 30% of the position; when the price breaks above the 15-day moving average, buy another 30%. Similarly, when it breaks above the 30-day moving average, buy the final 30%. This requirement must be strictly enforced.
3. If the price does not break above the 15-day moving average after breaking the 5-day moving average, but instead pulls back, as long as it does not break the 5-day line, maintain the original position; if it breaks, sell.
4. Similarly, if the price does not continue to break above the 15-day moving average after breaking it, hold as long as it does not break the 15-day moving average; if it breaks, sell 30% first. If it doesn’t break the 5-day moving average, hold the remaining 30% at the 5-day moving average.
5. When the price continues to break above the 30-day moving average and then pulls back, sell all at once as per the previous method.
6. Selling is the opposite; when the price is high, sell 30% if it breaks below the 5-day line. If it doesn't continue to go down, hold the remaining 60% position. If the 5-day, 15-day, and 30-day lines are all broken, sell everything; do not harbor any illusions.
A trading system is a tool that enables you to achieve stable profits.
It can help you mark key levels, discover entry signals, and find trading opportunities that can make you money.
So, back to the point, as long as there is a stable trading system, just act on the opportunities that arise within the system. If you lose, you can always take revenge; just do what you need to do, and leave the rest to the market, as in the end, you will always be able to cover losses with profits.
However, 99% of people’s biggest problem is that they do not have their own trading system, which makes them afraid of losing money when trading because once they lose that money, they cannot earn it back. Even if they earn it back by luck, they will ultimately lose it due to their own mistakes.
There’s a ridiculously simple method for trading that allows you to keep ‘earning forever’ and could make you 30 million! This method has achieved an 80% win rate! The top 10 chart patterns that every crypto trader must know can accurately predict market trends. Once you master it, the crypto market will be your ‘ATM’.
Chart patterns are one of the most effective trading tools for traders.
They purely reflect price behavior, formed naturally by the buying and selling pressure from both sides. Chart patterns have a proven reliable record, commonly used by traders to identify trend continuations or reversal signals, open positions, and predict price targets.
Chart patterns refer to specific price shapes on charts that can predict future price movements.
Since technical analysis is based on the fundamental assumption that 'history tends to repeat itself', these classic patterns repeatedly verify a high probability rule where specific price patterns often lead to corresponding price movements.
Therefore, chart patterns can be divided into:
(1) Continuation patterns — indicate that the current trend will persist;
(2) Reversal patterns — indicate that the trend is about to reverse.
This article will showcase the top ten classic chart patterns that every trader should know. The first part will detail reversal patterns and their application methods.
Reversal Patterns (Part 1)
Head and Shoulders pattern
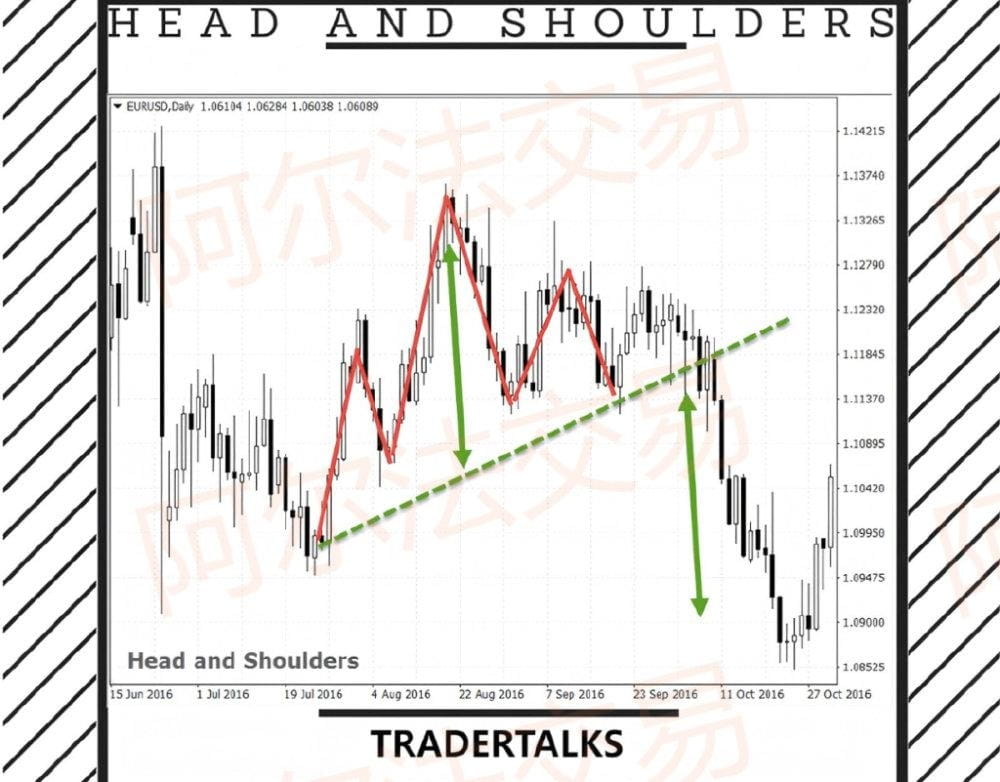
Head and Shoulders pattern is a classic graphic model indicating that the current trend is about to reverse.
This pattern consists of three peaks (high points), with the middle peak (head) being the highest (marked with a red line on the chart).
When a second peak appears after the middle peak, it indicates that the bulls can no longer push the price higher. The shape resembles a head with shoulders on both sides, hence the name.
The straight line connecting the low points of the two shoulders is called the neckline.
Important reminder: A downward break of the neckline signals a sell signal, with the target price being the vertical distance from the head's peak to the neckline (marked with a green arrow).
If the head and shoulders pattern appears in a downtrend, it is called the inverse head and shoulders pattern (composed of three troughs).
Double Top and Double Bottom
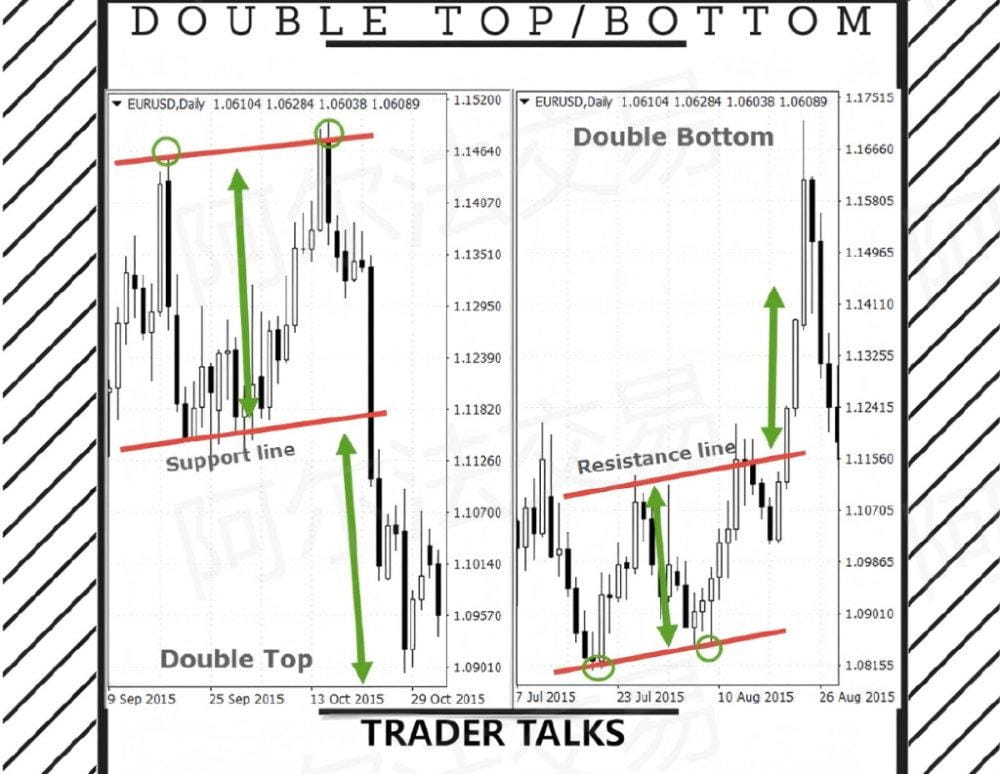
As another type of reversal pattern, Double Top and Double Bottom appear in uptrends and downtrends, respectively.
As the name suggests, a double top consists of two peaks that are close in height (or slightly different). It indicates that the bulls failed to break the previous high, and the trend may reverse.
Important reminder: When the price breaks below the support line of the pattern, it triggers a sell signal, with the target price being the vertical distance from the peak to the support line.
The double bottom pattern is the opposite, consisting of two troughs. It shows that bears cannot continue to push prices down. Buy when the price breaks above the resistance line, with the target price being the vertical distance from the trough to the resistance line.
Triple Top and Triple Bottom
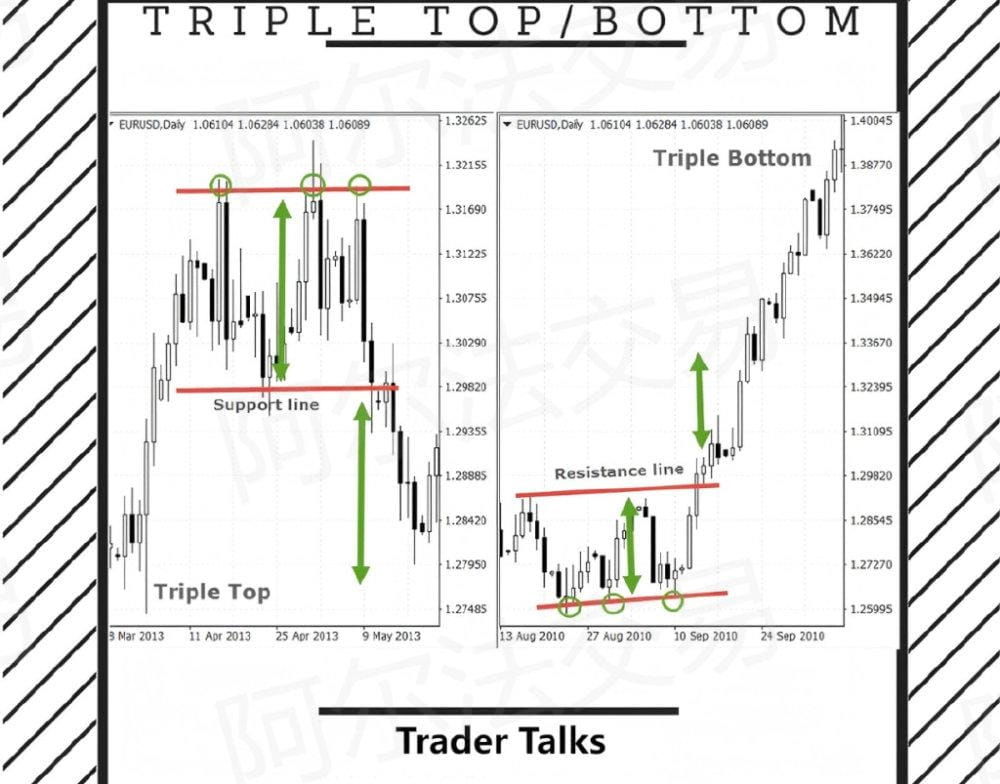
Triple Top/Bottom patterns are essentially extensions of Double Top/Bottom patterns. Both belong to reversal patterns, with the distinction that Triple Top/Bottom patterns consist of three peaks and troughs, respectively.
Important reminder: The trigger signal is also a breakout of support/resistance lines, with the target price calculated as follows: for triple tops, it is the vertical distance from the peak to the support line; for triple bottoms, it is the vertical distance from the trough to the resistance line.
Rounding Top
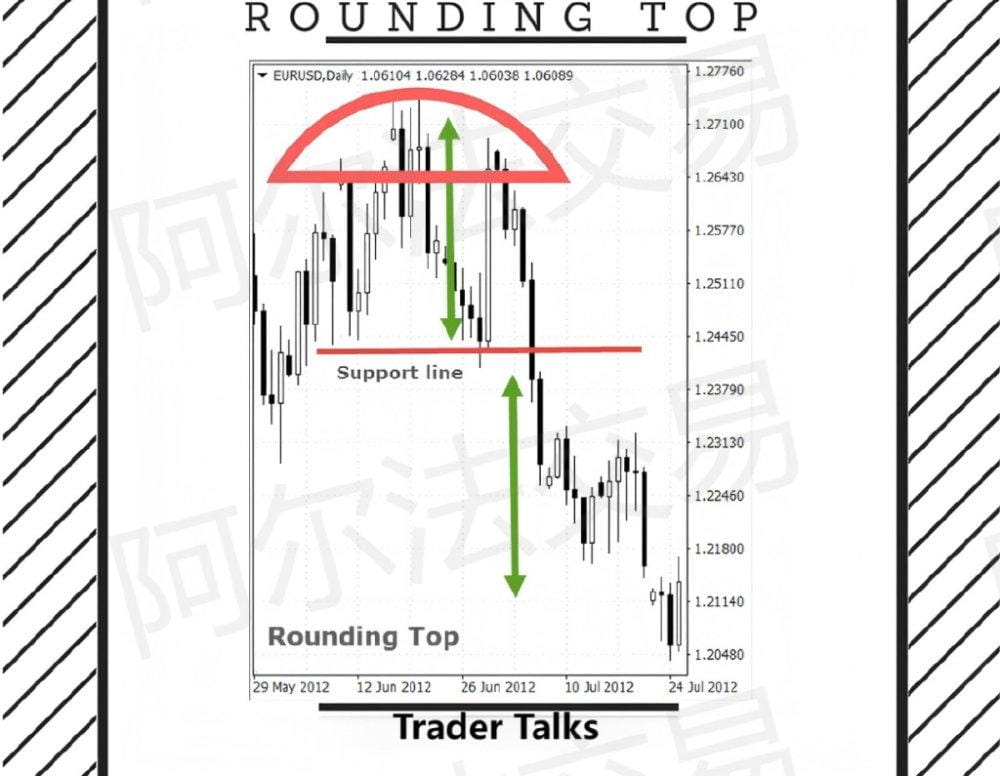
The formation cycle of the Rounding Top pattern is longer than that of other patterns in this article. It reflects the gradual transition of market sentiment from a bull market to a bear market. As shown in the chart, the price gradually builds a 'round top' outline.
Important reminder: A short signal is triggered when the price breaks below the support line, with the target price being the vertical distance from the top to the support line.
Rounding Bottom
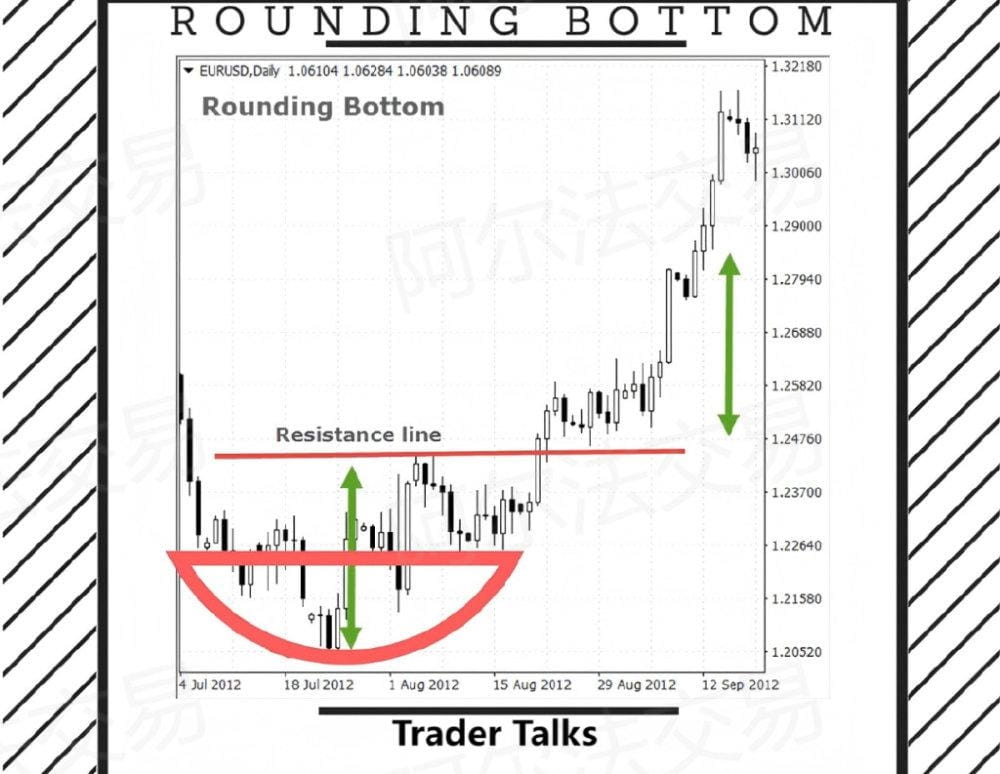
Rounding Bottom is the mirror image of the Rounding Top. The price completes a gradual reversal from the downtrend through the ‘round bottom’ structure.
Important reminder: Trading signals are the same as for the Rounding Top — using the breakout of the resistance line as a trigger point, with the target price being the vertical amplitude from the bottom to the resistance line.
Continuation Patterns (Part 2)
This article will reveal the most classic continuation patterns. Continuation patterns are as important as reversal patterns and are more suitable for trend-following trading strategies. If reversal patterns are suitable for contrarian traders and swing traders, then continuation patterns provide excellent entry points for trend traders. The upcoming patterns will open a new perspective on trading for you.
Rectangle pattern
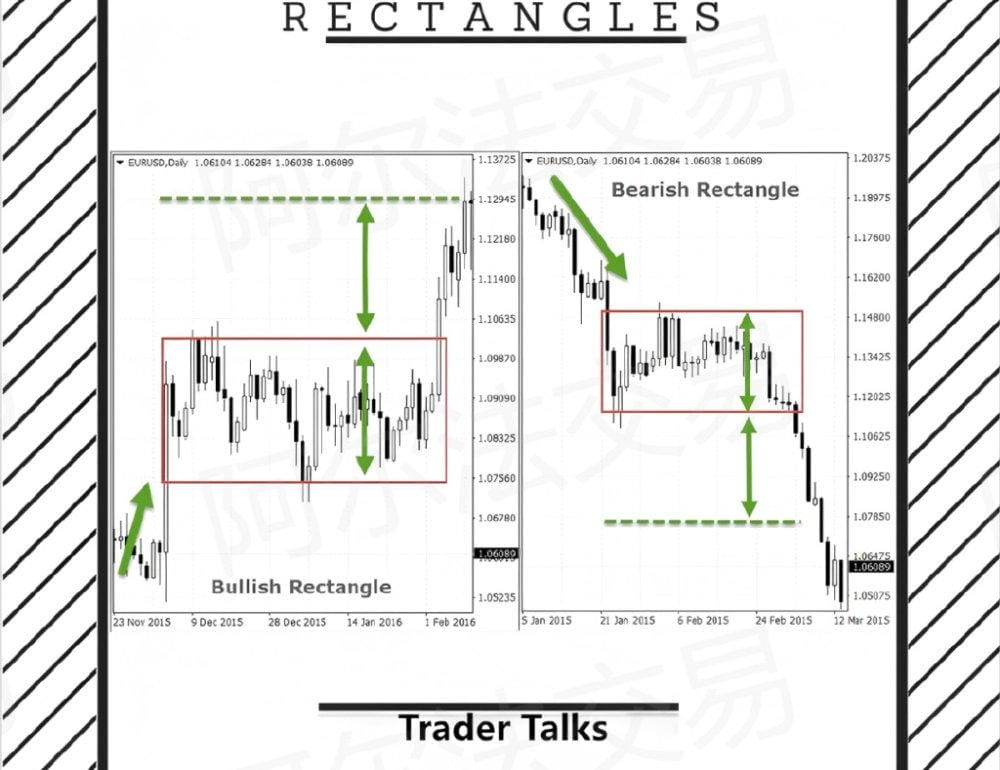
Rectangles belong to continuation patterns, confirming that the current trend will continue to develop. Based on the trend direction, it can be divided into bullish and bearish rectangles.
A bullish rectangle appears in an uptrend, forming when the price enters a consolidation phase, and is likely to break in the original trend direction.
Important reminder: A buy signal is triggered when the price breaks above the upper boundary of the rectangle, with the target price being the height of the rectangle.
A bearish rectangle applies the opposite rule, formed during the consolidation phase of a downtrend, indicating that the price will eventually break below the rectangle's lower boundary. The target price amplitude is similarly taken from the height of the rectangle.
Wedge pattern
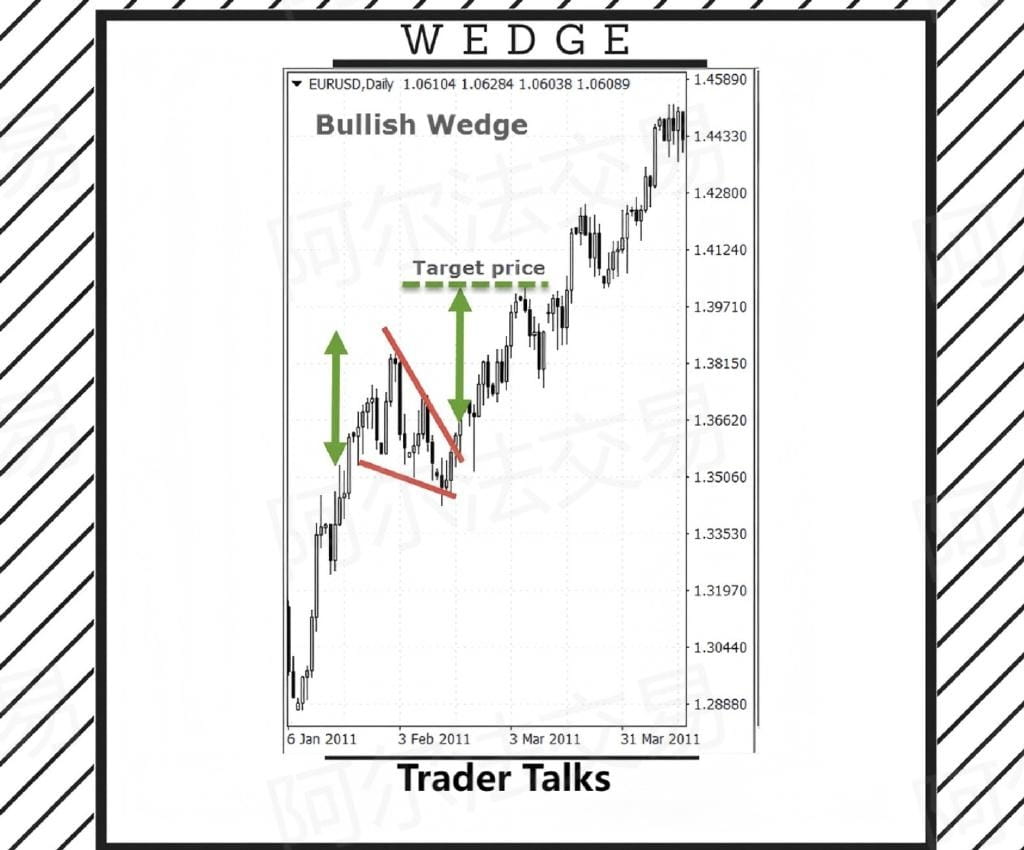
Wedges are another typical type of continuation pattern.
The bullish wedge appears in an uptrend, with the price gradually running within converging trend lines. This converging pattern indicates that bears are trying to suppress the price but cannot overcome the bullish force. Ultimately, the price breaks above the upper trend line, signaling the continuation of an uptrend.
Important reminder: The target amplitude is taken from the maximum vertical height of the wedge, projected the same distance from the breakout point.
The principle of bearish and bullish wedges is the same, but it appears in a downtrend, with an overall upward slope. Converging trend lines indicate that bulls have briefly interrupted the downtrend, and when the price breaks below the lower boundary, it indicates that bears have regained control. The target amplitude is similarly projected from the maximum height of the wedge.
Flag pattern
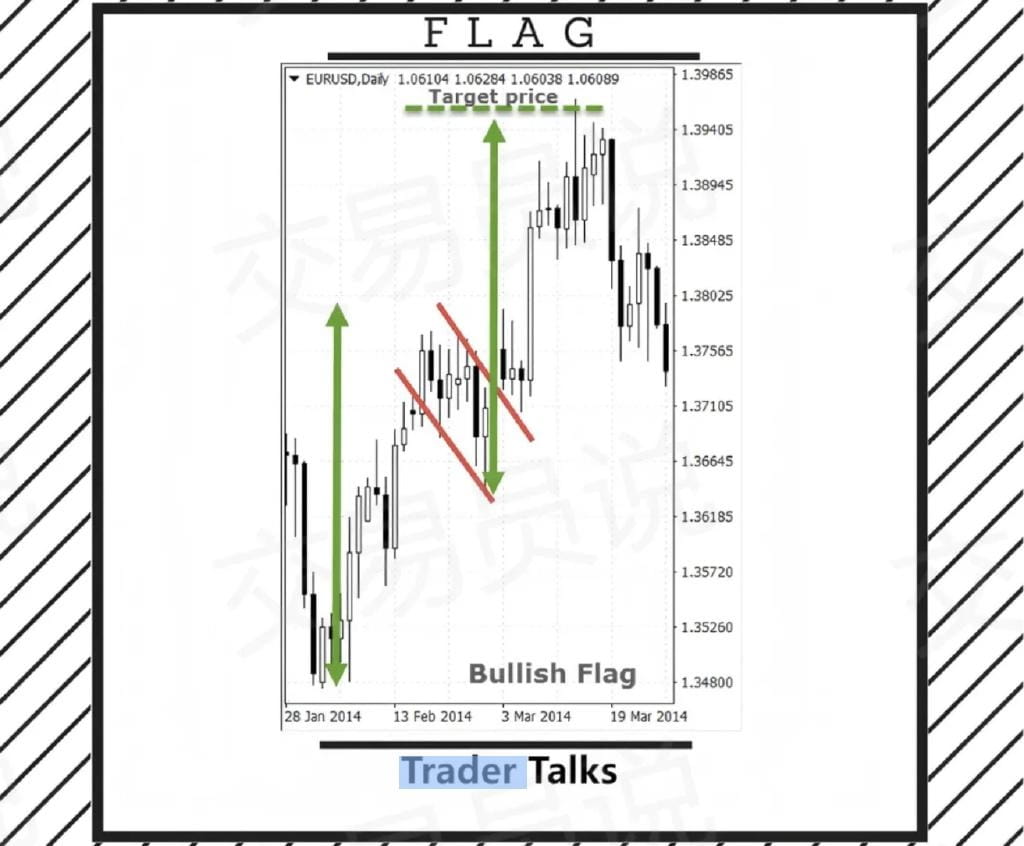
Flags are similar to wedges but consist of parallel (rather than converging) trend lines, and include a characteristic flagpole structure. The method for calculating target levels is unique, differing from other chart patterns.
Flags can be bullish or bearish; the above image shows a bullish flag.
In an uptrend, a bullish flag pattern will form, with parallel trend lines above and below the price movement, creating a downward slope.
Important reminder: Breaking above the trend confirms that the uptrend is recovering.
The bearish flag and bullish flag are fundamentally the same; the difference is that the bearish flag forms in a downtrend and has an upward trend.
The method for calculating target amplitude: take the vertical height of the flagpole (green arrow), projected from the end of the flag (the lowest point for bullish flags / the highest point for bearish flags).
Triangle pattern
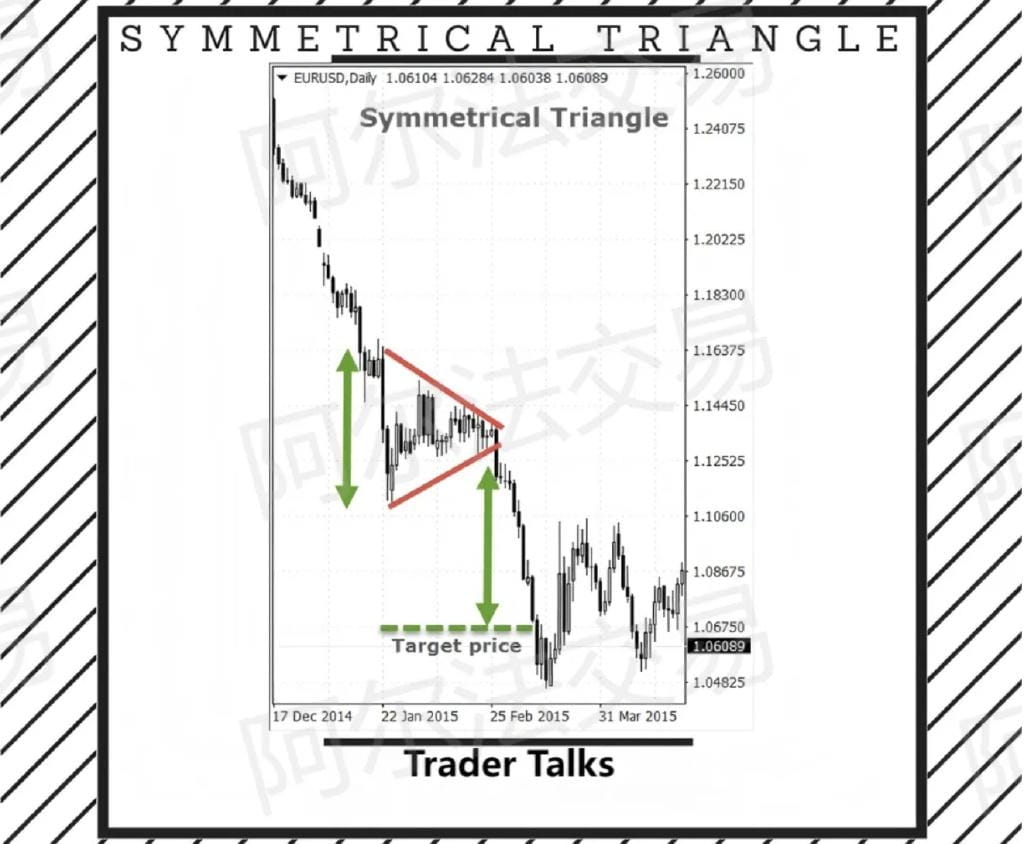
Triangles are divided into ascending triangles, descending triangles, and symmetrical triangles.
These three types of triangles look very similar, but the difference is that the ascending triangle has a flat upper trendline, while the descending triangle has a flat lower trendline.
Symmetrical triangles are the most common patterns, similar to wedge patterns, but the slope does not point upward or downward, without a clear slope tendency.
Important reminder: In a downtrend, breaking below the lower trendline indicates the continuation of the downtrend; conversely, breaking above the upper trendline in an uptrend confirms the existing uptrend.
The target price equals the maximum height of the triangle, projected outward from the breakout point.
Cup and Handle pattern
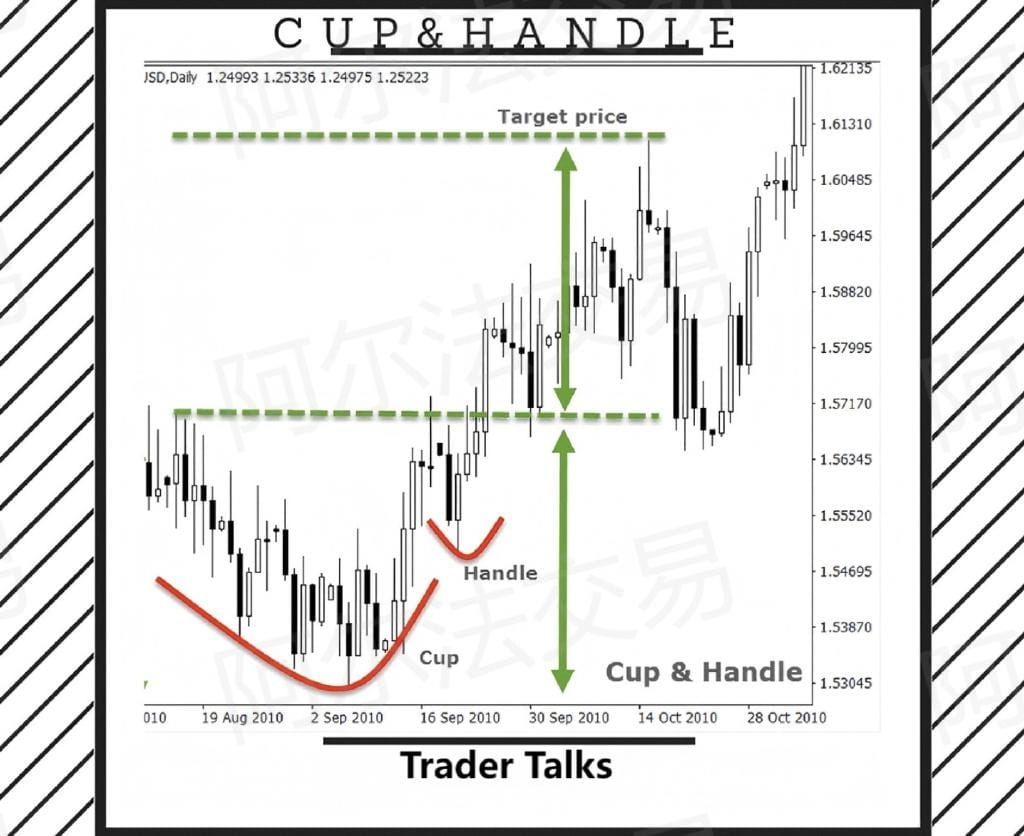
Cup and Handle pattern is a rounding top pattern characterized by an additional pullback (the 'handle' part) after the rounding top. It is a continuation pattern indicating that in an uptrend, sellers are trying to push the price down, but market sentiment gradually shifts from sellers to buyers.
In addition, the pullback (formation of the handle) is the last attempt by sellers to take control of the market. When the price breaks above the resistance line (green dashed line), the method for calculating the target price is based on the height of the cup and handle pattern.
Inverse Cup & Handle pattern usually appears in a downtrend, with rules opposite to the conventional Cup and Handle pattern.
Summary
The main purpose of this article is to show you another perspective on trading. As you can see, these chart patterns may help in judging trend direction, but you should not rely solely on them.
Old Wang only does real trading; the team still has positions, hurry over #非农就业数据来袭 $BTC


