🔎 Key Fibonacci Levels (depth 1000 chart) / Set at 1000 to closely track 4 year cycle
0.618 → $3,839 (recently reclaimed, now support)
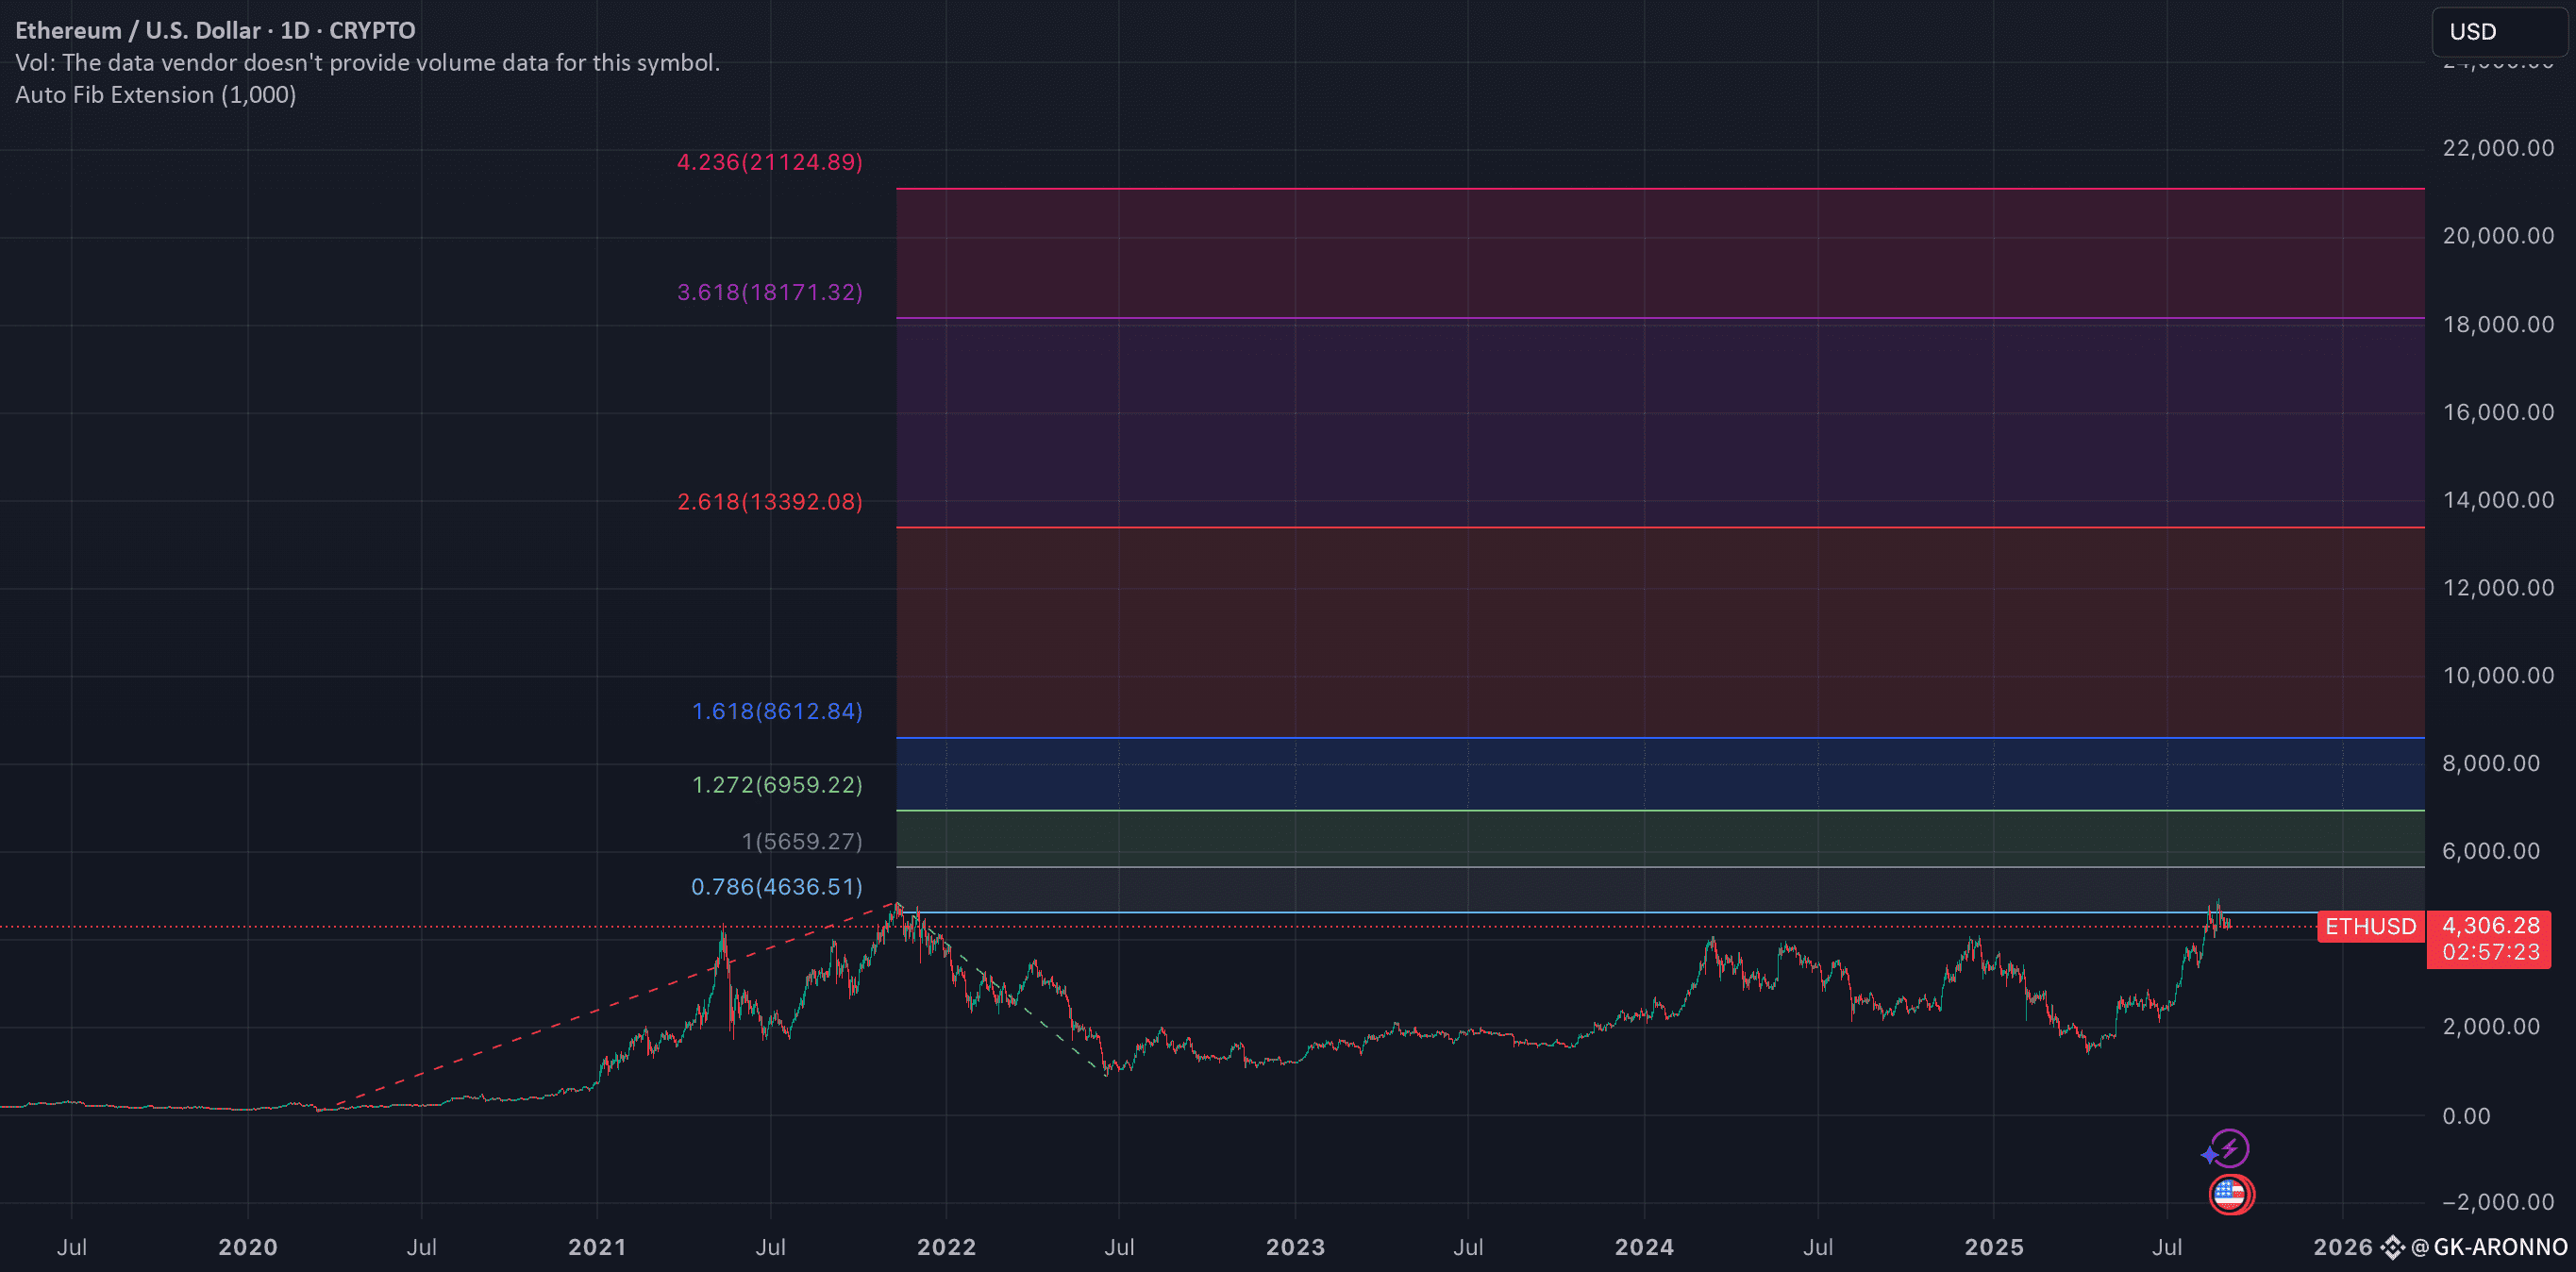
0.786 → $4,636 (current resistance zone)
1.000 → $5,659 (macro breakout confirmation)
1.272 → $6,959
1.618 → $8,612
2.618 → $13,392
3.618 → $18,171
4.236 → $21,124
📊 Probabilistic Outlook (based on history + structure)
0.786 ($4,636): Very close overhead. Odds of testing = 80–90% in this cycle.
1.000 ($5,659): Historically tagged in every ETH cycle. Odds = ~85% if bullish structure holds.
1.272 ($6,959): Tagged in all past ETH bull cycles. Odds = ~75%.
1.618 ($8,612): Historically hit in every run. Odds = ~65%.
2.618 ($13,392): Hit in both 2017 and 2021. Odds = ~45% (usually requires euphoric late-cycle blowoff).
3.618 ($18,171): Hit in 2/3 historical cycles. Odds = ~25–30%.
4.236 ($21,124): Extreme extension, only tagged in strongest cycles. Odds = ~15–20% (basically “mania top” territory).
⚖️ Summary
High confidence: ETH tests $5.6k–7k (1.0 → 1.272 Fib) this cycle.
Likely but needs momentum: ETH pushes to $8.6k (1.618 Fib).
Possible in full mania: $13k (2.618 Fib).
Euphoric blow-off only: $18k–21k (3.618–4.236).