---
🚨 QNT/USDT 4H Chart Analysis – Traders’ Eye View 🚨
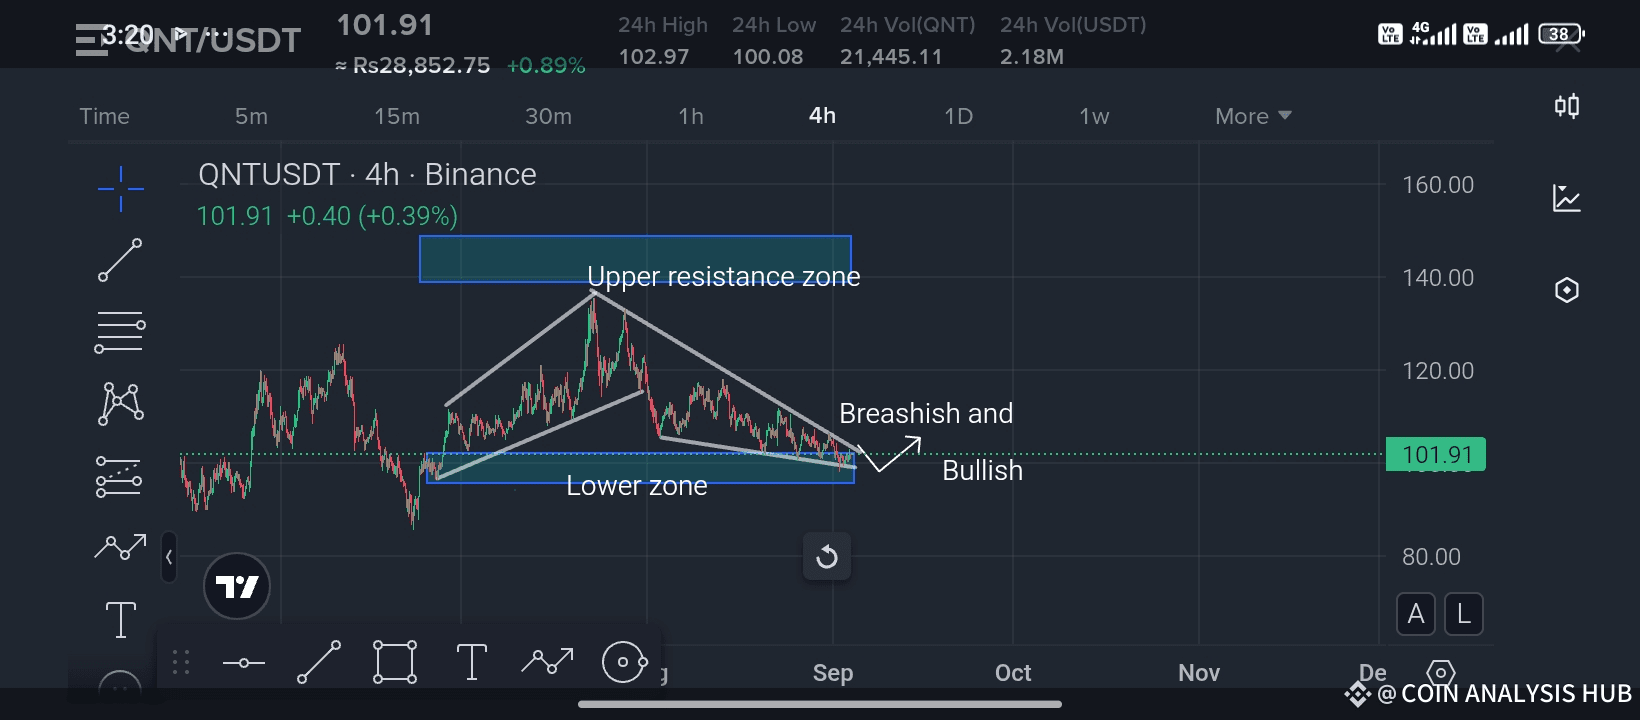
Currently, QNT is trading around $101.91 (+0.39%) and is consolidating in a very crucial zone where both bullish and bearish forces are clashing. Let’s break it down technically 👇
🔹 Chart Observation
Price action has been squeezing into a symmetrical triangle, which usually leads to a strong breakout.
The upper resistance zone lies between $135–$150, which has acted as a strong supply zone in the past.
On the downside, the lower support zone is sitting around $95–$100, where buyers have stepped in multiple times.
🔹 Current Situation
Price is now trading near the apex of the triangle, which indicates a decision point.
A break above the resistance trendline could push QNT back toward $120–$135 levels in the short term.
A break below the support trendline may drag the price back toward $90 or even lower.
🔹 Trader’s Eye Catch
Market is in a neutral-to-slightly bullish structure right now, but confirmation will only come with a clear breakout.
Smart traders will be watching closely for a volume-backed move before entering positions.
📌 Pro Tip:
Always wait for confirmation before entering trades. Breakouts with low volume are often traps.
⚡ If you like this type of analysis, don’t forget to LIKE 👍, SHARE 🔄, and FOLLOW ✅ my channel for more real-time market updates and professional insights. The more you support, the more motivated I get to bring you quality trading setups every day! 💯
###ListedCompaniesAltcoinTreasury
Best of luck 🤞 🍀 🤞