 🔹 Structure & Trend
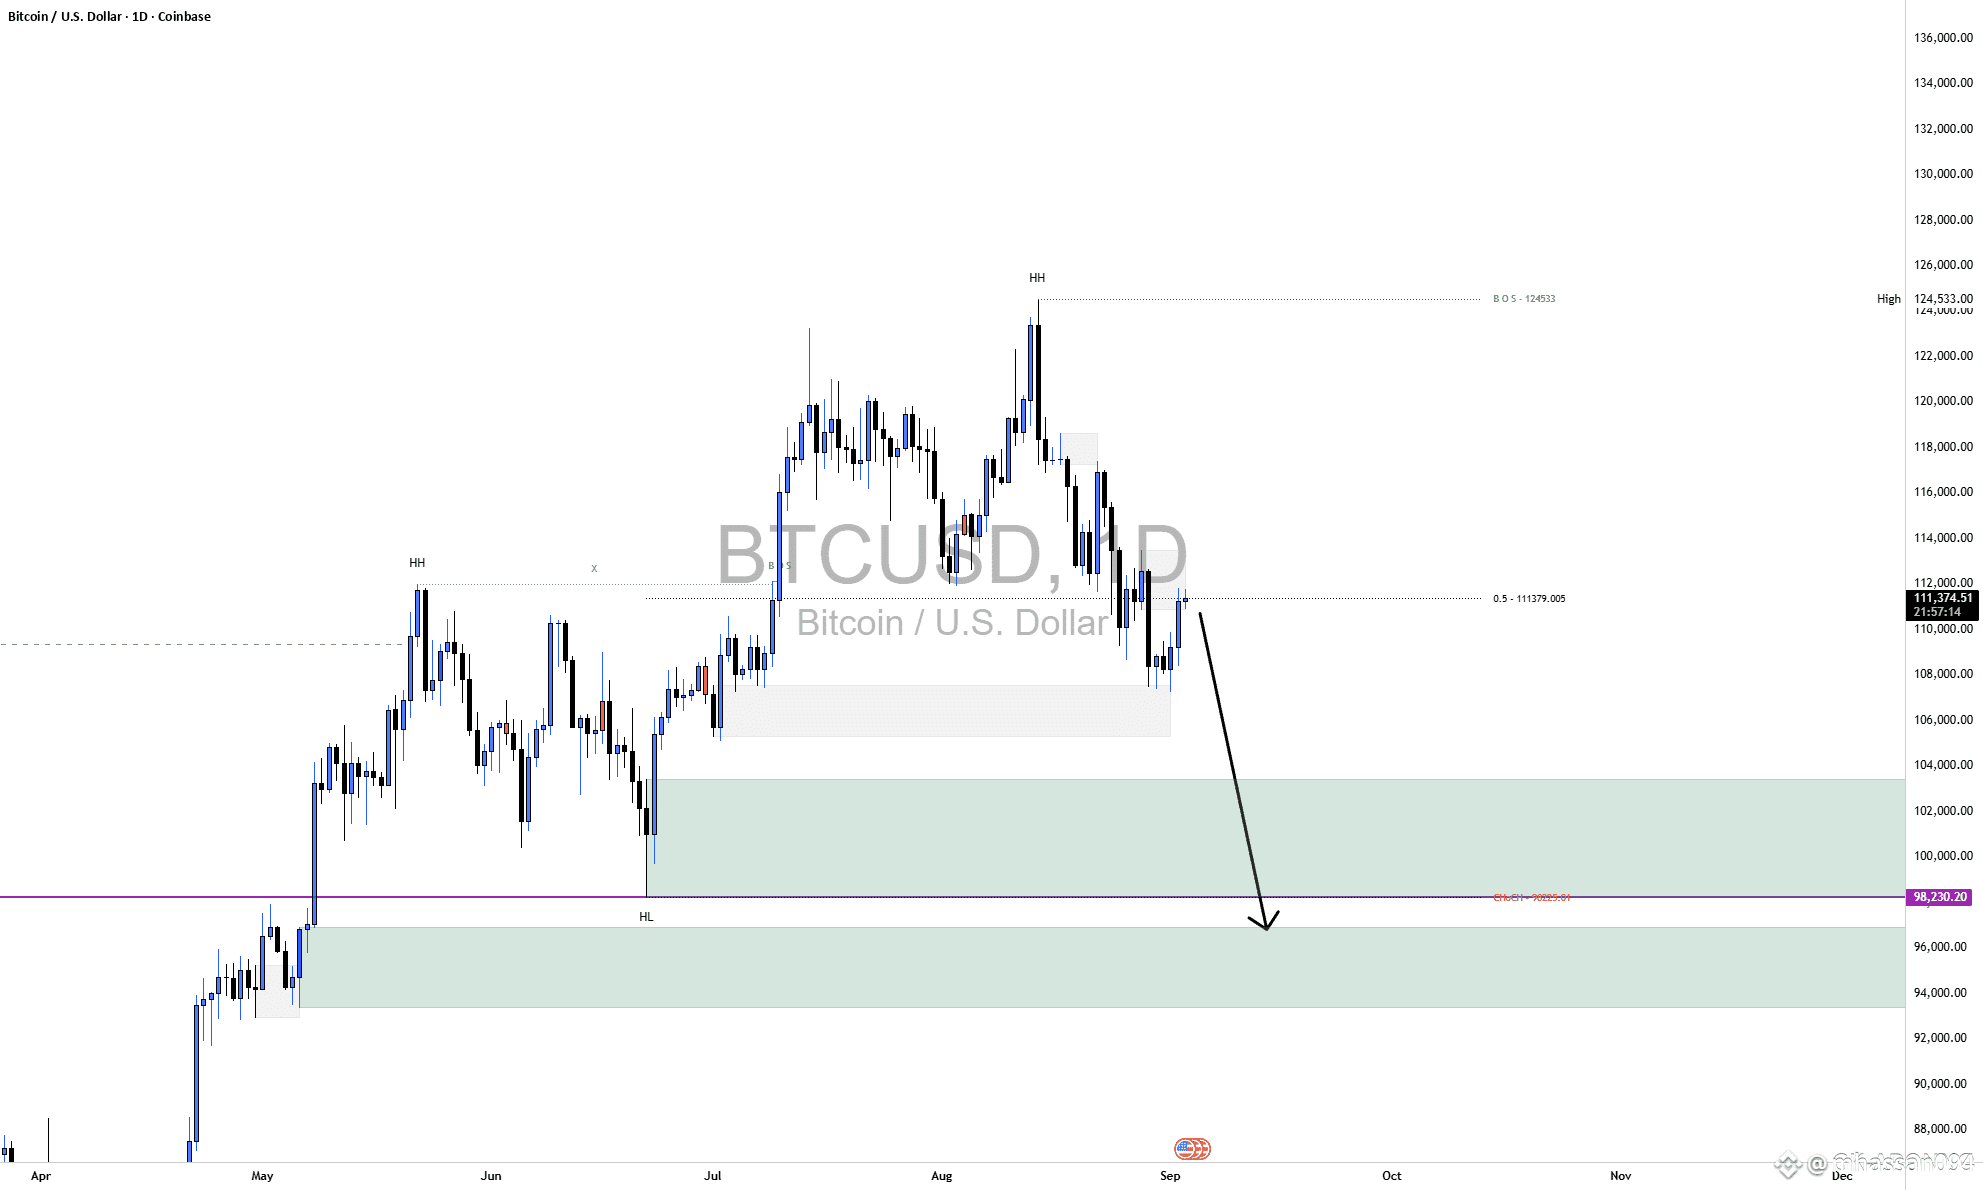
Bitcoin has shifted from a strong uptrend into a corrective phase. After making a higher high near $124,533, price failed to sustain momentum and rolled over.
The most recent Break of Structure (BOS) occurred at $112,879, confirming weakness as price broke below a prior swing low.
No clear Change of Character (CHoCH) back to the upside has formed yet, which keeps sellers in control.
🔹 Key Supply & Demand Zones
Demand Zone: $92,000 – $99,000
Historically strong zone where buyers stepped in aggressively.
Likely to be tested again after rejection above $120k.
Midrange Zone: $111,000 – $112,000
Previously acted as support but was broken decisively.
Now behaving as resistance (supply).
Supply Zone: $118,000 – $120,000
Strong rejection area where sellers dominated.
Acts as a major upside cap unless reclaimed.
🔹 Price Action (Current Region)
Bitcoin is retesting $111,000–$112,000, the breakdown level.
Rejection wicks and hesitation confirm supply absorption.
The arrow projection points toward $98,730, aligning with the demand zone.
If price fails to reclaim $112,800–$113,000, probability favors continuation lower.
🔹 Trade Bias & Outlook
Bias: Bearish
Primary Target: $98,700
Extension Target: $92,000 – $94,000 (if momentum accelerates)
Invalidation: Daily close above $113,000 would flip bias and open path for $118,000–$120,000 retest.
🔹 Momentum & Candles
Momentum favors sellers:
Down moves = impulsive
Rallies = corrective
Recent candles show long upper wicks + small real bodies, confirming supply pressure.
Without strong bullish candles breaking resistance, sellers remain dominant.
⚠️ Summary: Bitcoin is in a corrective structure, sellers control momentum, and downside targets between $98,700–$94,000 remain valid unless bulls reclaim above $113,000.
Do you want me to also mark this outlook on a Bitcoin chart with zones & arrows so you can visualize the setup clearly?
