When smaller timeframes look quiet, it’s often best to zoom out and revisit the bigger picture. That’s exactly what we’re doing with $ADA today analyzing both the bullish and cautionary scenarios on the higher timeframes.
🔶 The Bullish Scenario (Orange Count)
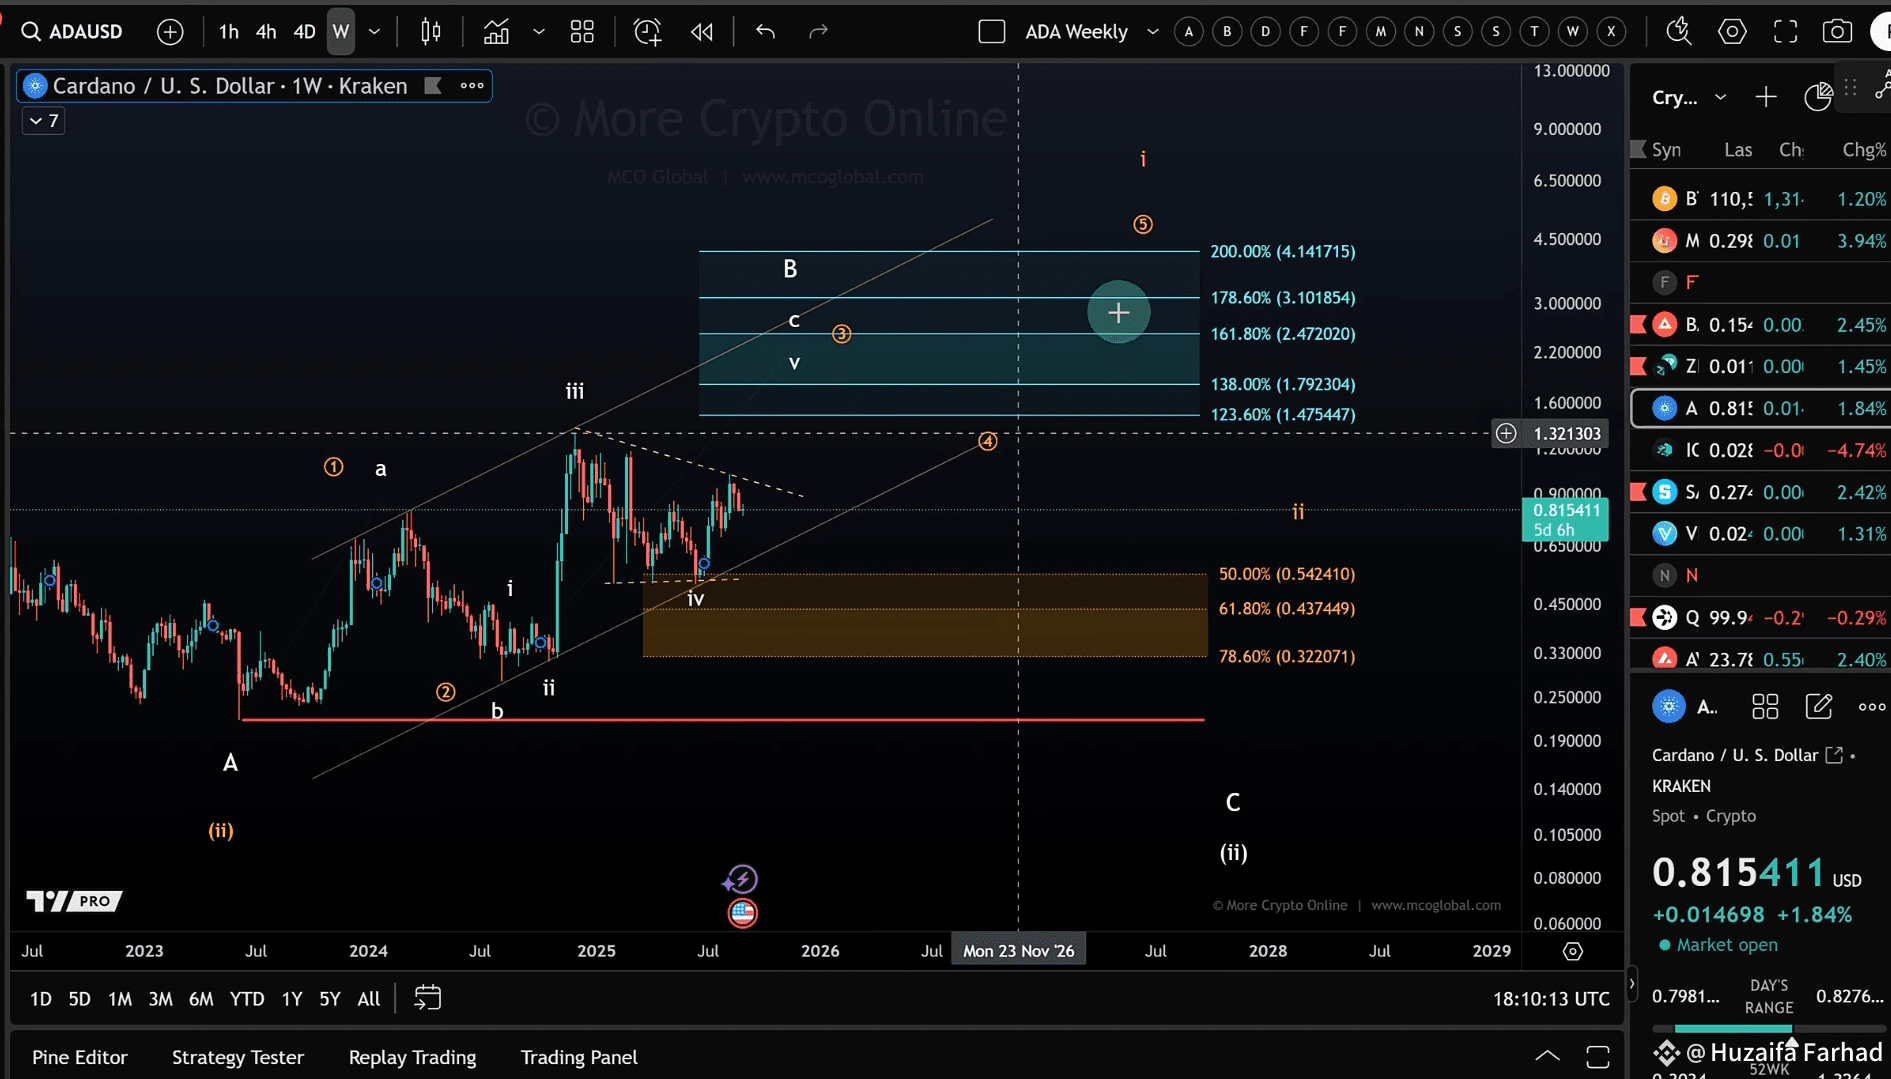
On the larger timeframe, we’re tracking a potential 5-wave move to the upside.
There’s some debate whether this should be viewed as a classic impulse or a diagonal pattern, since the structure moves more in a price channel than in an explosive manner.
Key invalidation level: As long as the June swing low at $0.51 holds, ADA has room to grind higher.
👉 In a third wave, the market should reach at least $1.79.
First resistance: $1.47 (slightly shallow for a full 3rd wave).
Ideal target: $1.79 or higher.
If we see an extended move, wave 3 could even reach $3.10, opening the door for wave 5 targets between $4–$5.
⚪ The Alternative Scenario (White Count)
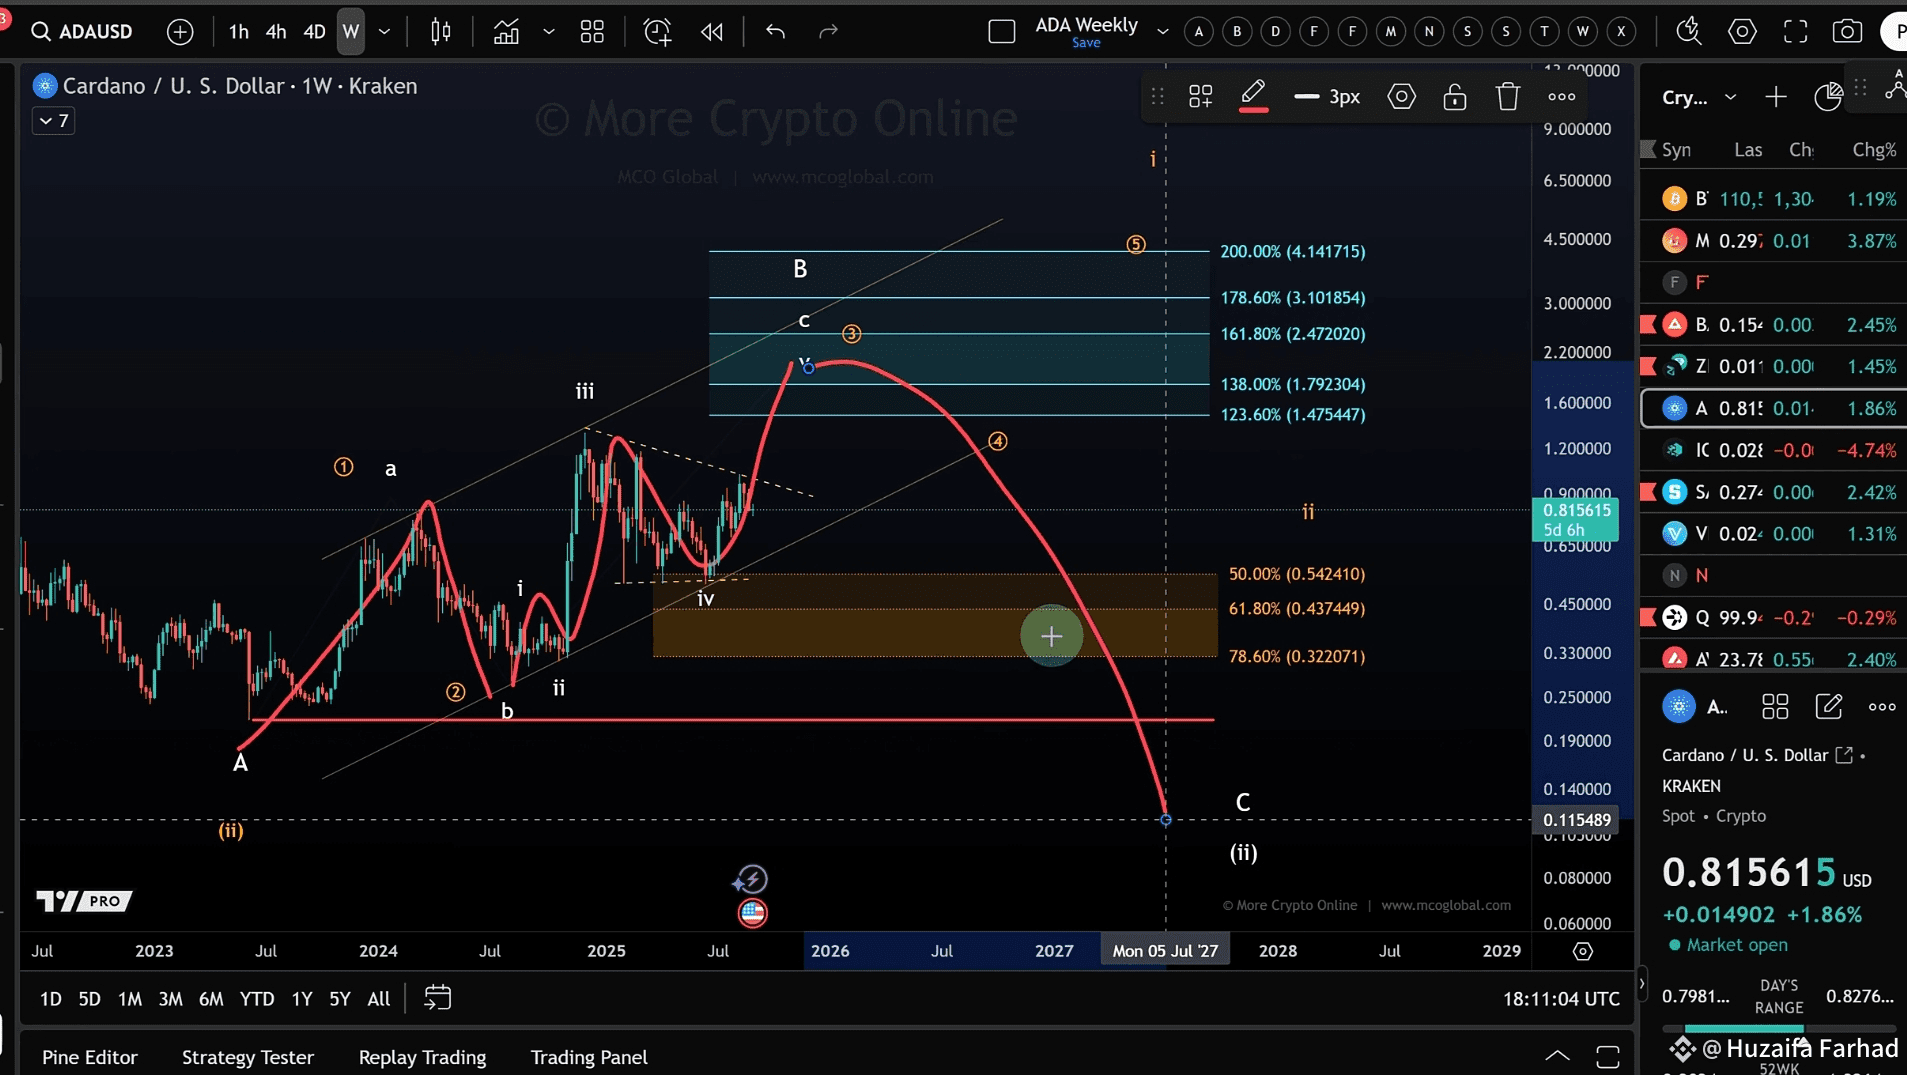
Another possibility is that ADA is tracing out a larger A-B-C correction:
A-wave completed,
B-wave pullback done,
and now in a final C-wave with 5 sub-waves.
If this scenario plays out:
ADA could still reach $1.47 – $1.79 in the next leg up.
But once support breaks, that may be the top of this corrective rally.