🚀 ETH/USDT 4H Chart Technical Analysis 🚀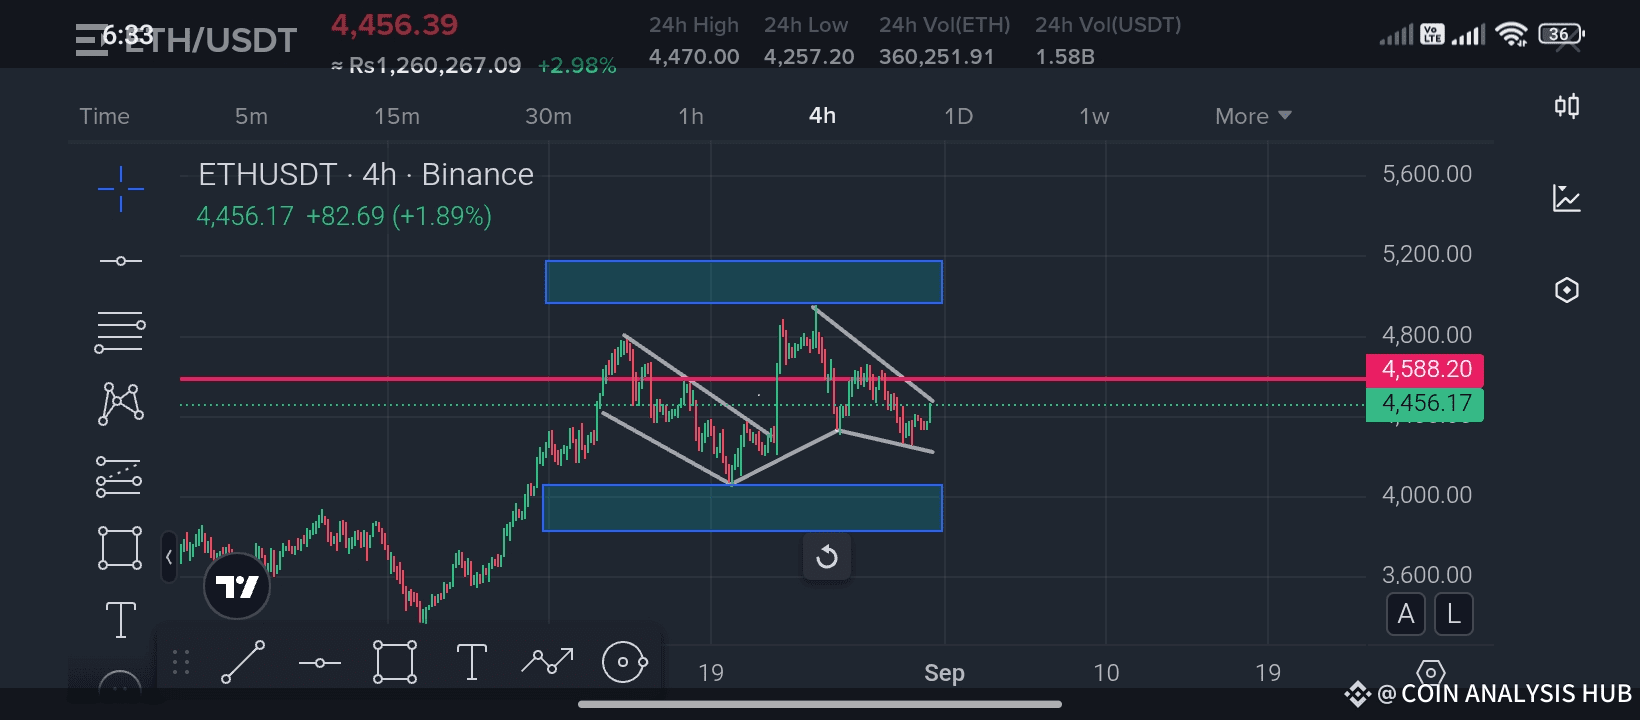
Currently, ETH is trading around $4,456 after gaining nearly +1.89% in the last 24 hours. The price action is showing some very interesting technical setups that every trader should keep an eye on 👀.
🔎 Key Observations:
1️⃣ ETH is moving inside a descending channel (falling wedge formation), which is often considered a bullish reversal pattern if confirmed by breakout.
2️⃣ Price has tested the mid-level resistance zone near $4,588 multiple times but hasn’t closed above it yet – this makes it the most important level to watch.
3️⃣ On the downside, the support demand zone is around $4,250 – $4,300. If this level holds, ETH could bounce strongly back toward upper resistance.
4️⃣ The bigger supply zone sits near $4,800 – $5,000, and a breakout above $4,588 could open doors for a rally towards this area.
📊 Possible Scenarios:
✅ Bullish Case: If ETH breaks above the descending channel and closes above $4,588, we can expect strong upward momentum, targeting $4,800 – $5,000.
❌ Bearish Case: If ETH fails to hold support at $4,250, the price could revisit the lower demand zone around $4,000 – $4,100.
💡 Trader’s Tip: Always wait for a confirmed breakout before entering heavy positions. Patience pays more than chasing candles!
✨ If you find my analysis helpful, don’t forget to LIKE 👍, COMMENT 💬, and SHARE 🔄 this post with your trading community. Also, hit that FOLLOW ✅ button to stay updated with more professional and eye-catching market breakdowns. Let’s grow together, traders! 📈🔥
#MarketPullback
#USGDPDataOnChain
#DogeCoinTreasury
#PCEMarketWatch
#MITOBinanceWalletTGE
