$SOL chart is still following the larger bullish pathway, and the daily trend remains intact even though price action has been messy. Let’s break it down step by step so you can see the bigger picture and the important levels to watch.
📈 The Bigger Picture (Daily Chart)
The daily chart continues to show that Solana is trending upward.
We have not yet broken above the key yellow trend line on the chart.
Pullbacks are normal as long as Solana holds the main support zones.
The lowest zone that still keeps the uptrend alive is between $109.94 – $133.49.
A higher support zone sits between $141.43 – $172.60 (think of this as “interim support”).
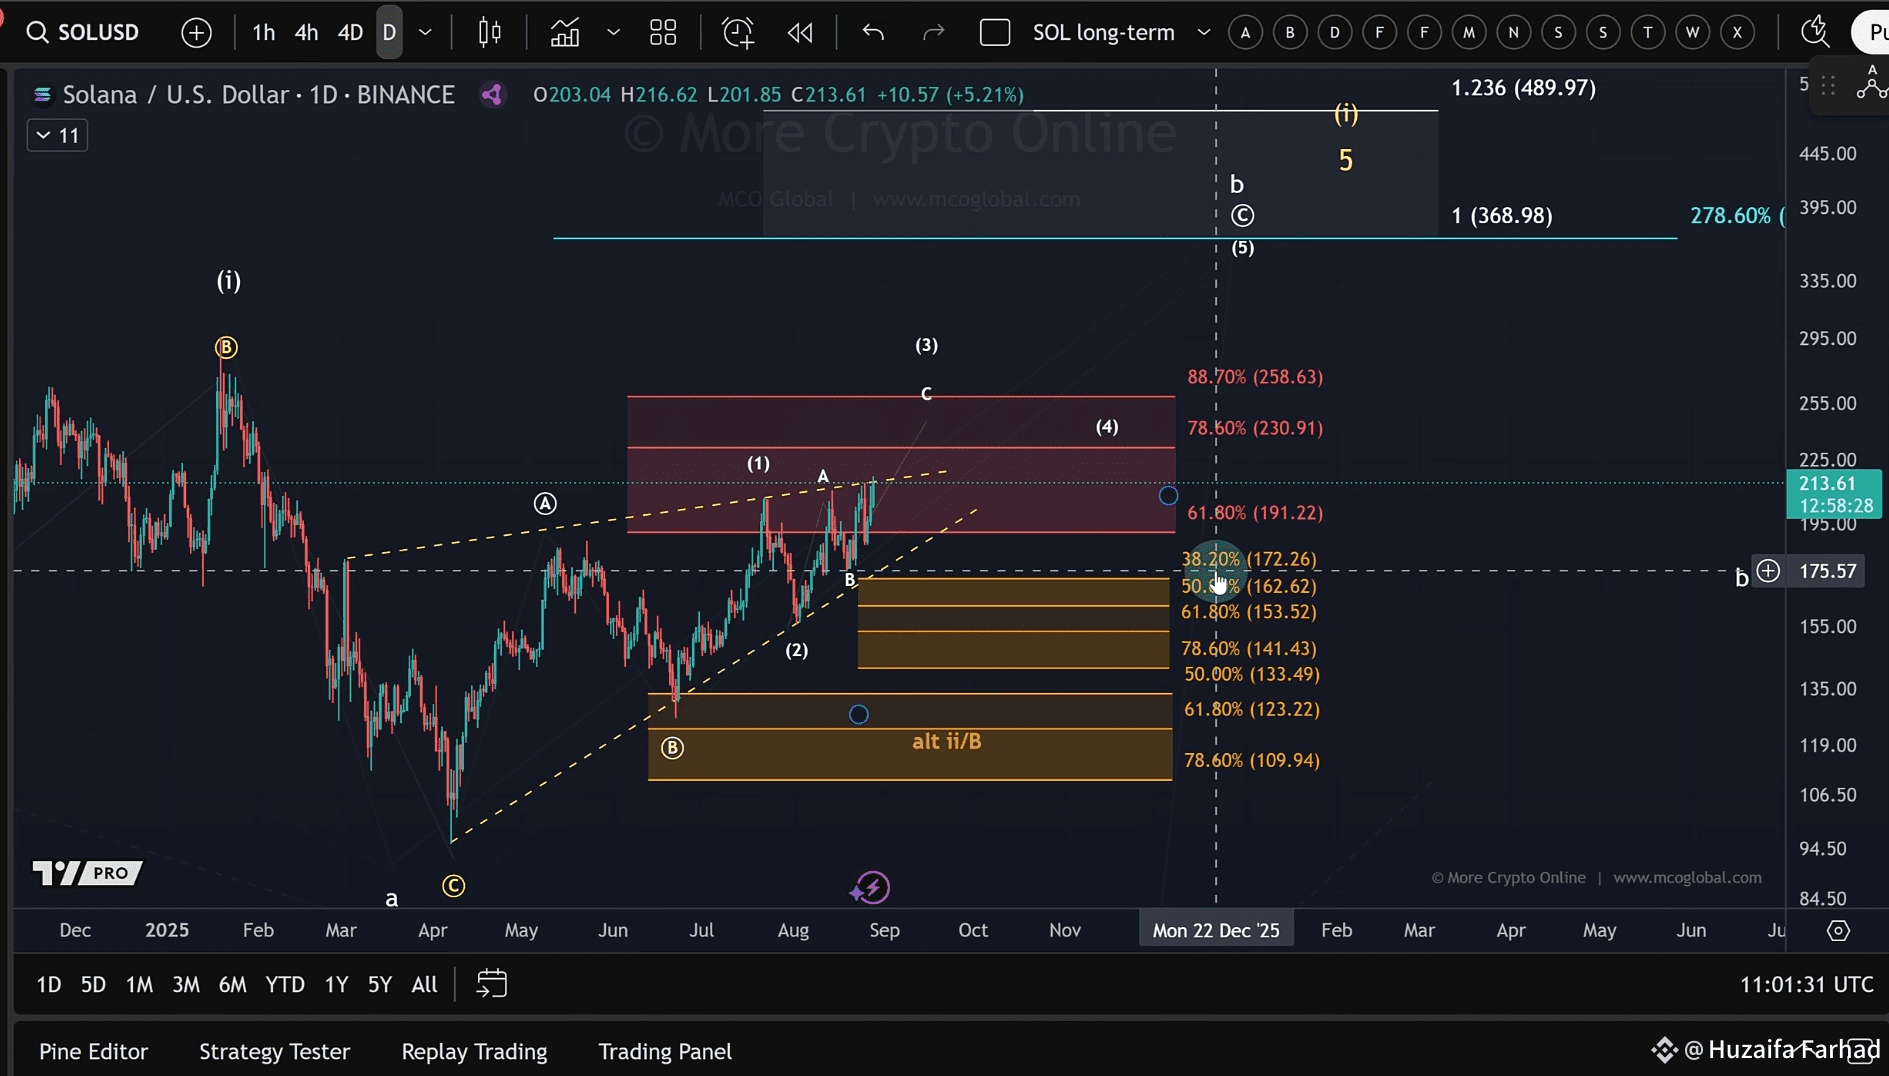
Even if Solana dips lower into these ranges, the larger bullish setup stays valid. Remember, wedges can sometimes break down, but for now the price is still pressing against the upper boundary.
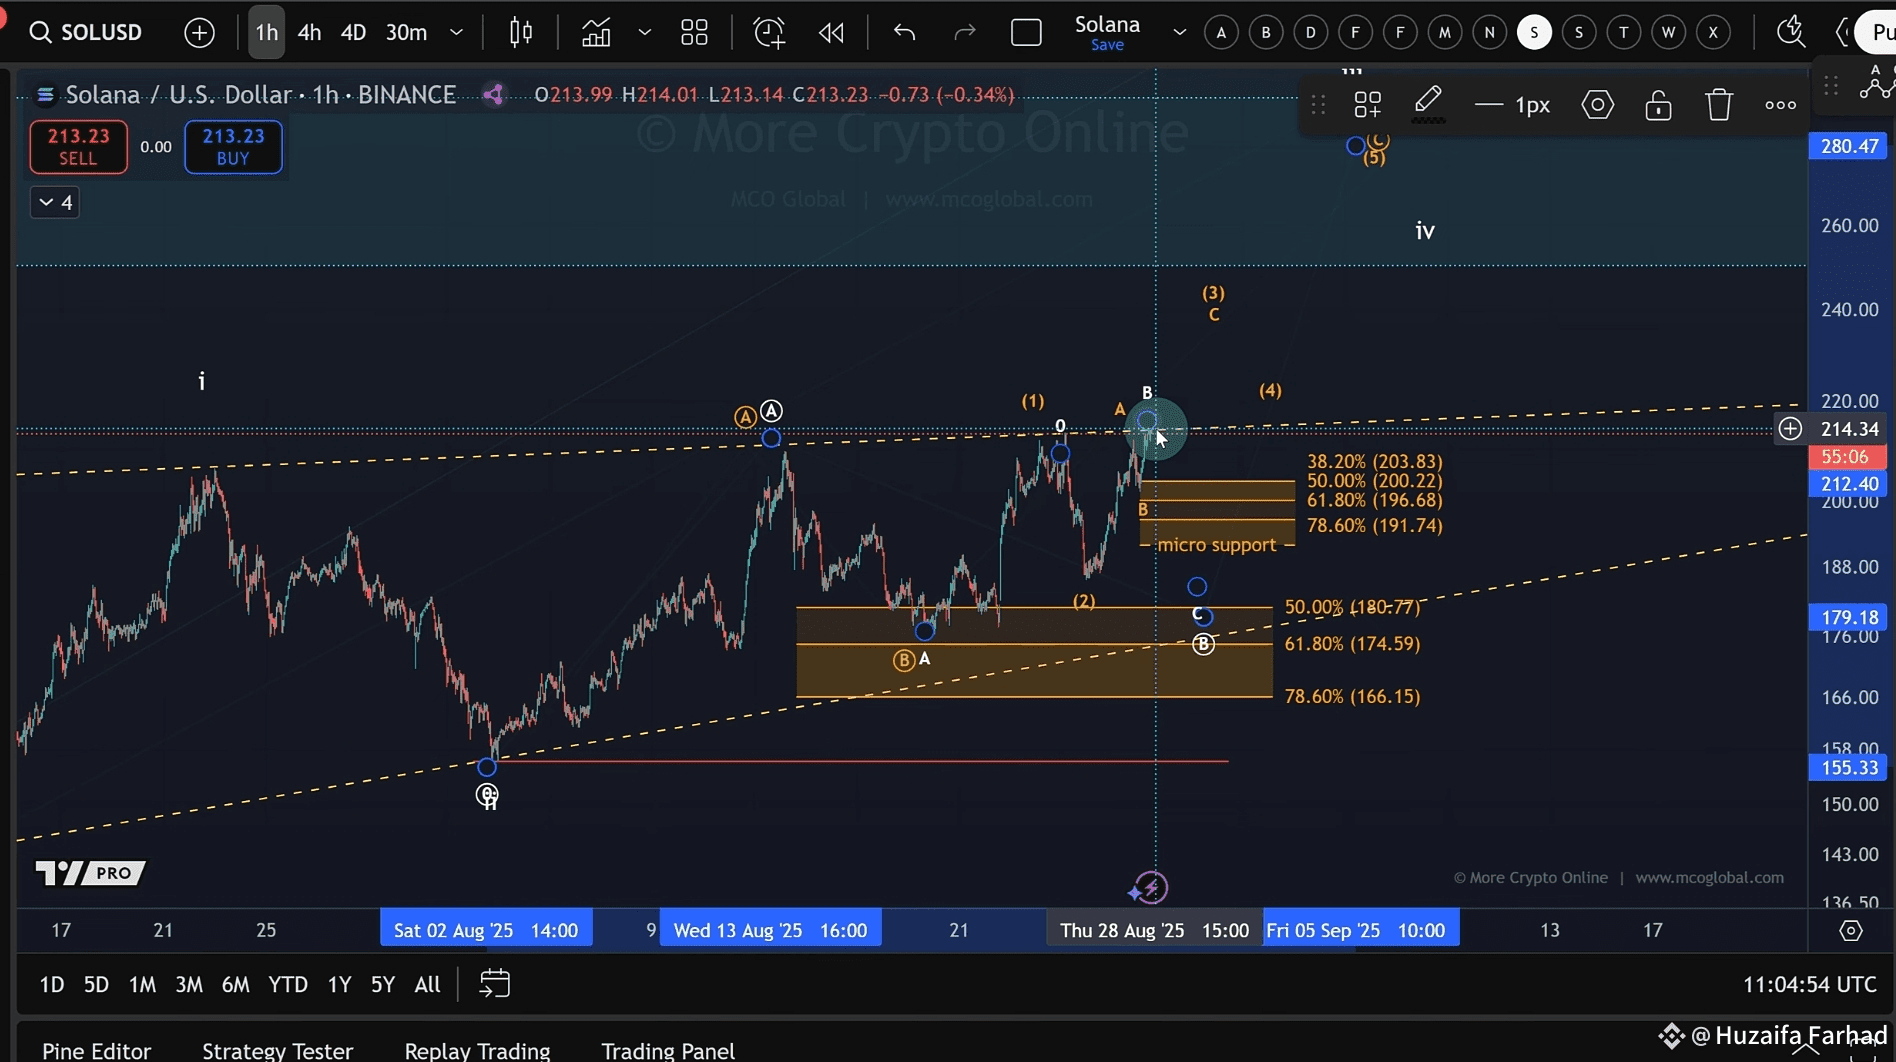
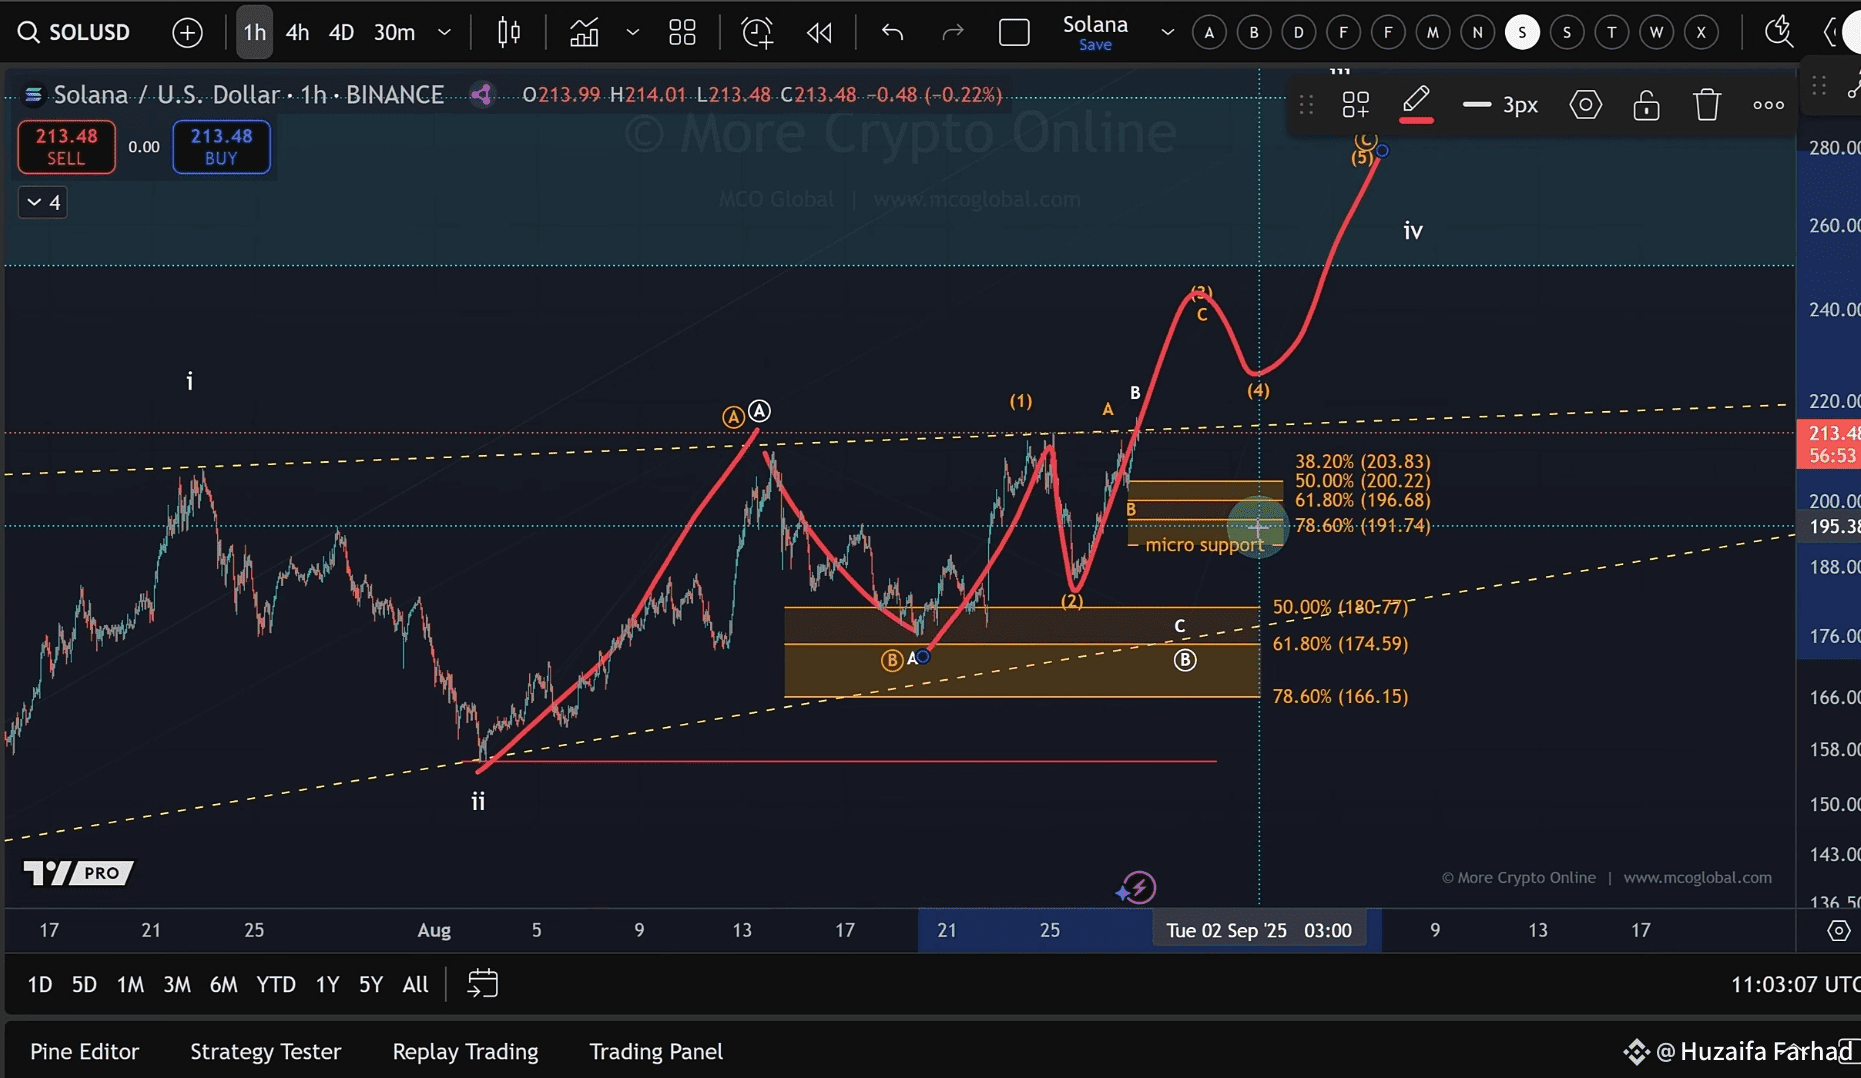
⏳ Zooming In (1H Chart)
On the shorter time frames, the structure looks like this:
From the August low, Solana has been trending up in an ABC structure.
Two roadmaps remain valid:
1. Direct pathway → B-wave already bottomed, and we’re in a C-wave rally targeting $250+.
2. Alternative pathway → B-wave still unfolding, meaning Solana could retest lower support before heading higher.