$BNB Current Price and Key Indicators
Current Price: The chart shows BNB at $869.90. This is a recent high and a significant level to watch.
24h High/Low: The 24-hour high is $872.81, and the low is $850.85, indicating recent price volatility and upward movement.
Moving Averages (MA): The chart shows a 5-period and a 10-period moving average. The current price is trading above both of these, which is a bullish sign.
MA(5): $198,456.907 (This appears to be a mislabeled data point on the image and is likely not the actual MA(5))
MA(10): $251,425.850 (This also appears to be a mislabeled data point)
Bollinger Bands (BOLL): The Bollinger Bands are shown as a key indicator. The price is trading at the upper band, which suggests strong upward momentum but could also indicate that it is overbought in the short term, potentially leading to a slight pullback.
Upper Band (UP): $897.35
Middle Band (MB): $845.94
Down Band (DN): $794.53
Volume: The 24-hour trading volum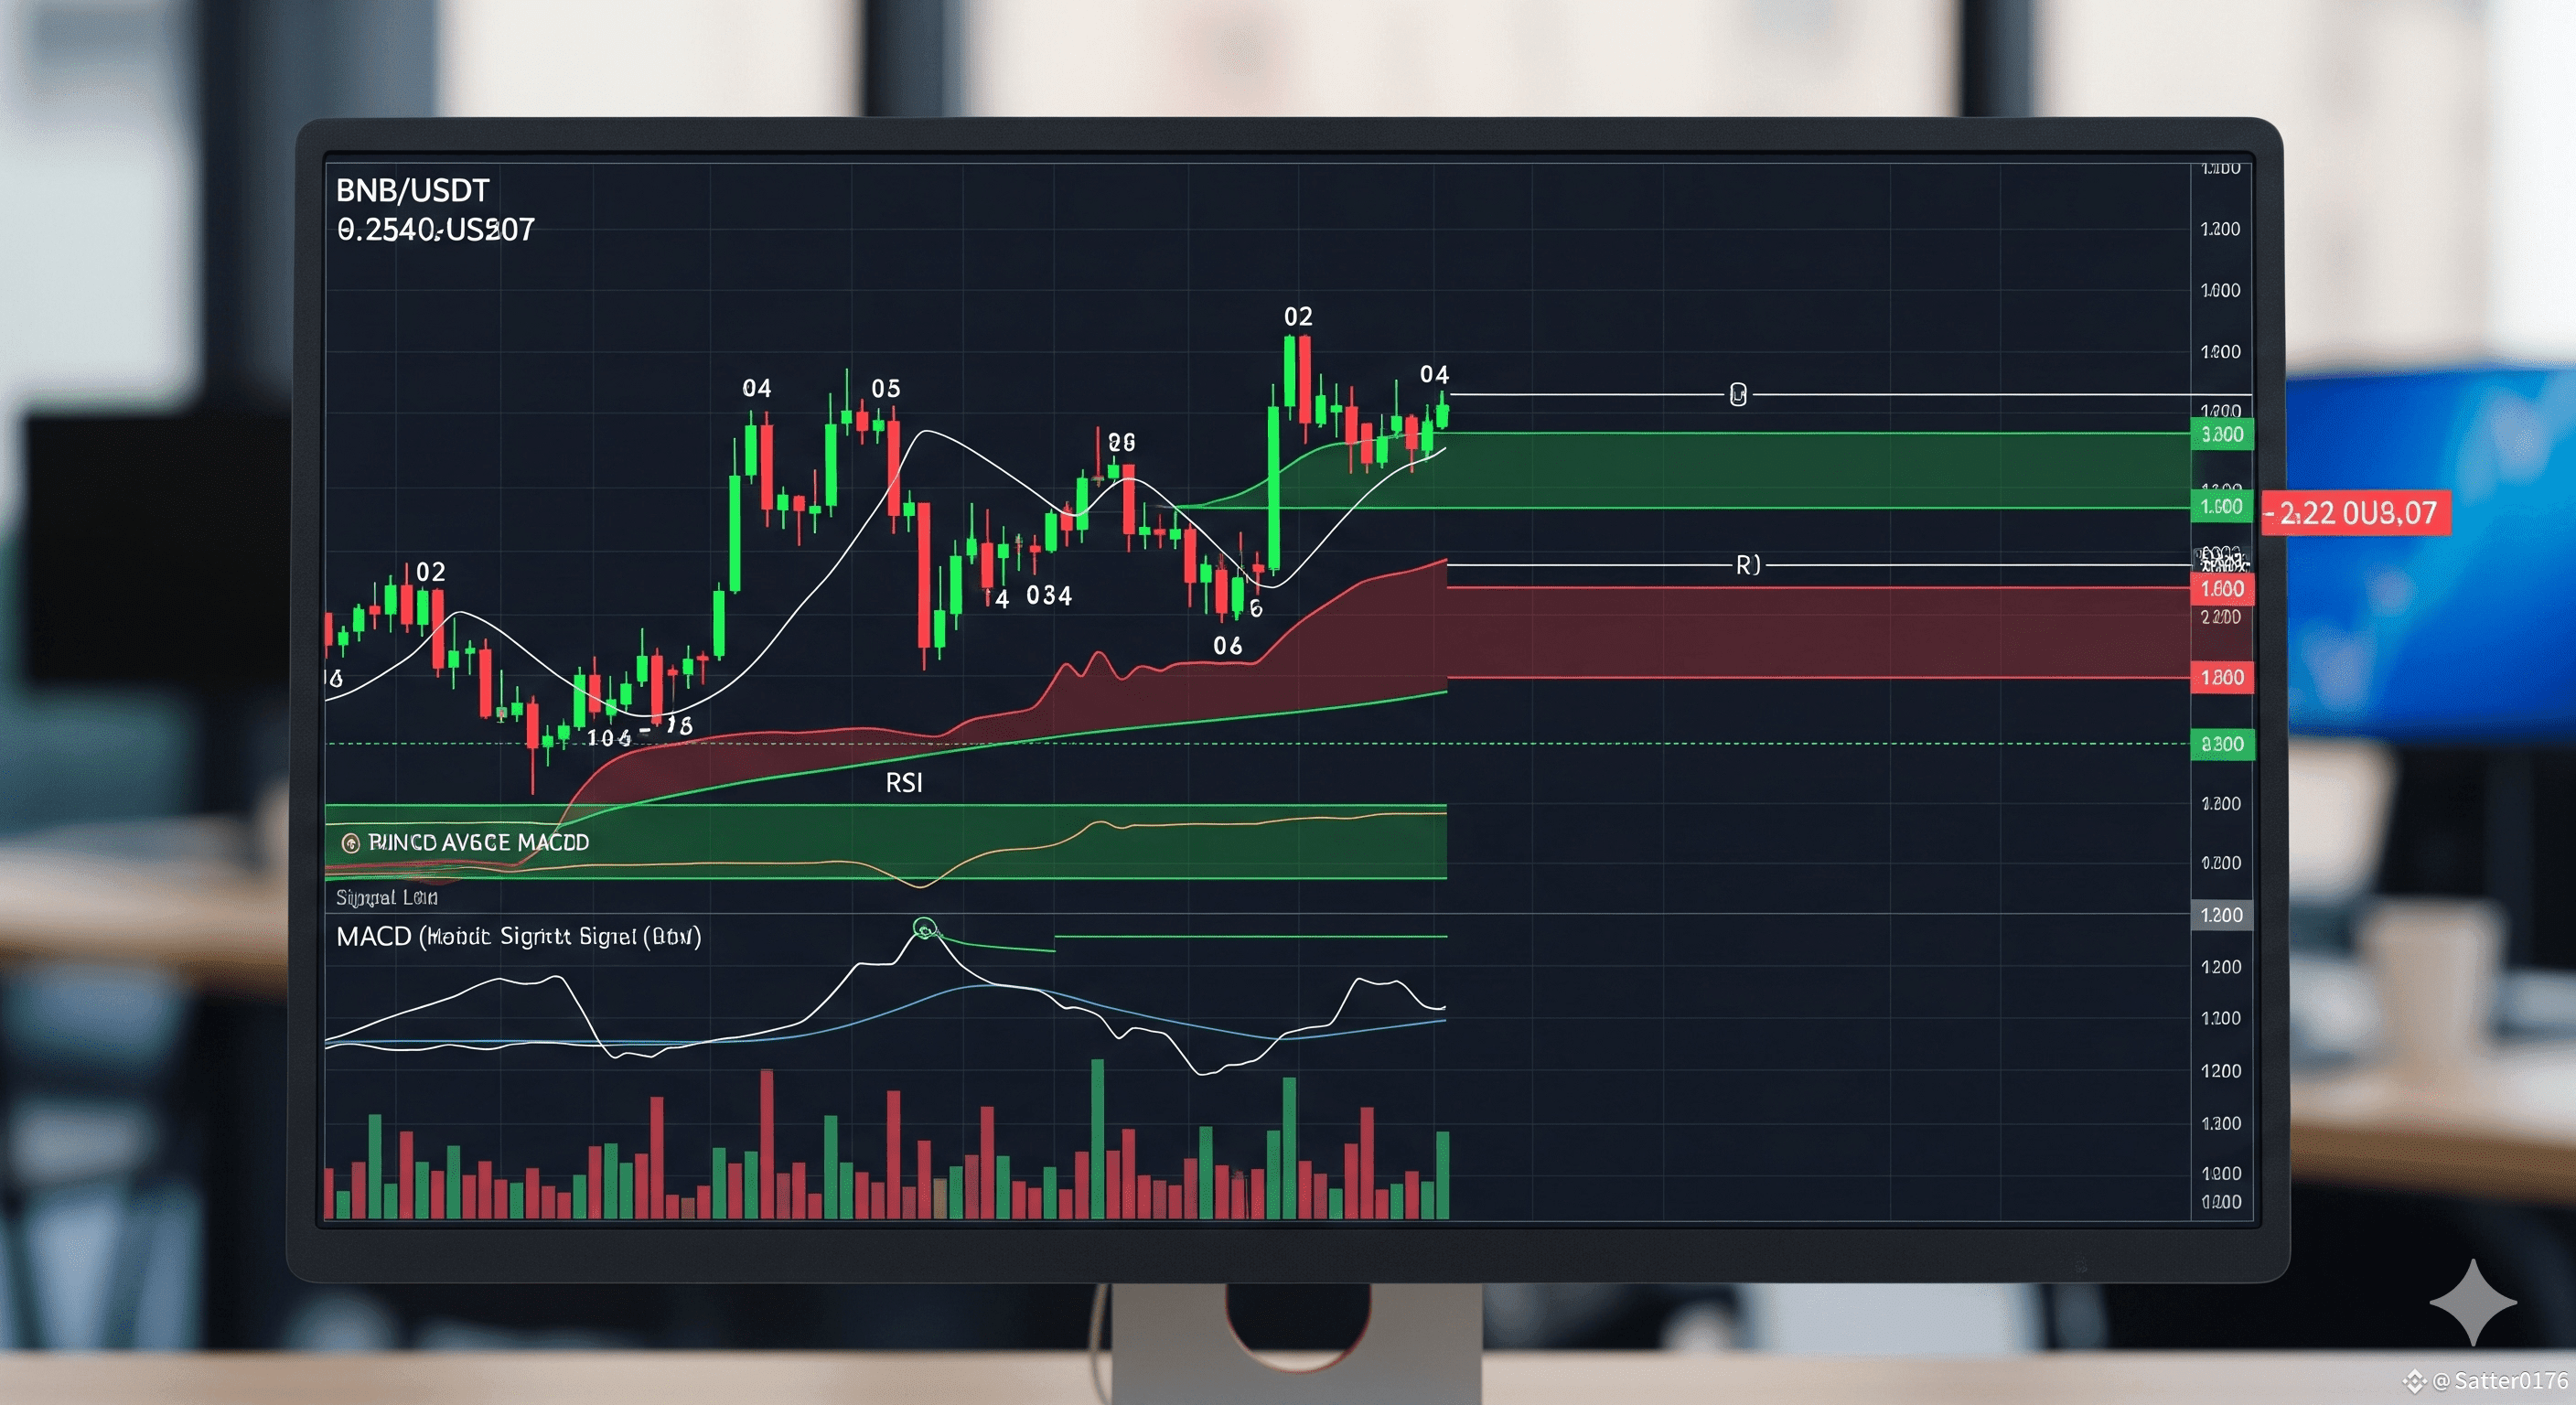 is high for both BNB ($157.354M) and USDT ($135.38M), suggesting strong market interest and liquidity.
Technical Analysis and Outlook
Bullish Momentum: The chart clearly shows a strong uptrend. The price has been consistently making higher highs and higher lows, a textbook sign of a bullish market structure. The price is currently well above its key moving averages, reinforcing the upward trend.
Potential Resistance: The all-time high of $900.71 is a major resistance level. This is a critical point that the price needs to break to continue its ascent. A successful break above this level could lead to a new price discovery phase.
Support Levels:
Immediate Support: The middle band of the Bollinger Bands at $845.94 could act as a key support level if a short-term pullback occurs.
Stronger Support: The previous high around the $800 mark could also serve as a strong support zone.
Possible Scenarios:
Scenario 1 (Continuation of Bullish Trend): If the buying pressure continues and BNB successfully breaks above the $900.71 resistance level, it could target a new all-time high, with the next psychological target being $1000.
Scenario 2 (Short-Term Correction): Given that the price is at the upper Bollinger Band, there's a possibility of a slight correction. If the price pulls back, it would likely test the middle band at $845.94 or the previous support around $800. A healthy pullback could consolidate the gains before another leg up.
Summary
The technical analysis of the BNB/USDT chart indicates a strong bullish trend. While the price is approaching a key resistance level and may be due for a minor correction, the overall momentum is positive. The next major move depends on whether BNB can decisively break above the $900 mark.#BTC走势分析 #BNB_Market_Update