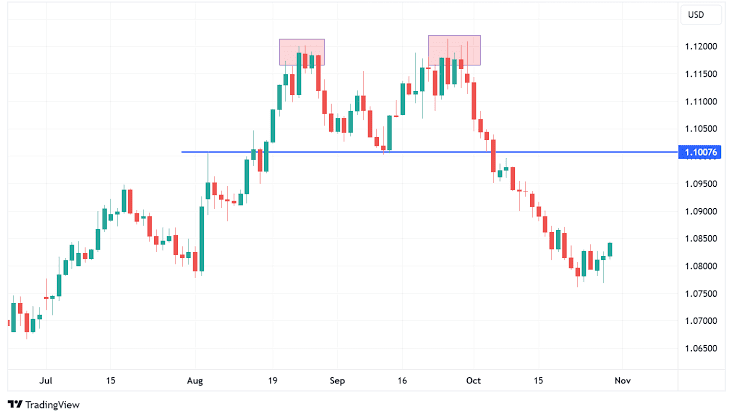
1. Head and Shoulders (Bearish Reversal)
Price first makes a left shoulder, then a higher peak (head), then a right shoulder (lower high).
When the neckline breaks down, it signals trend reversal → price likely falls.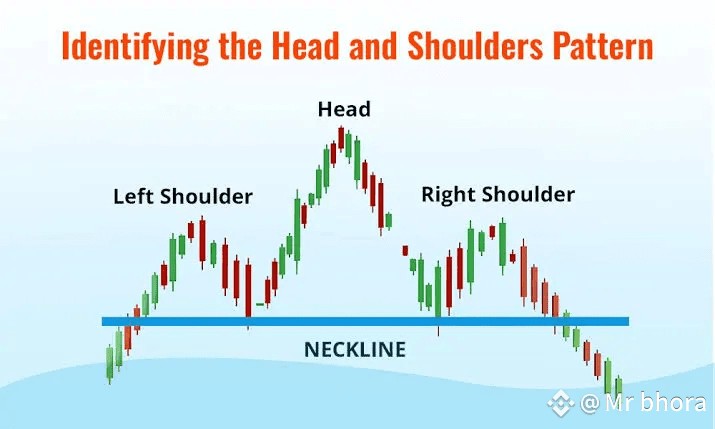
2. Inverse Head and Shoulders (Bullish Reversal)
Opposite of head & shoulders.
Price makes a low (left shoulder), then a deeper low (head), then a higher low (right shoulder).
Break above the neckline = strong bullish reversal.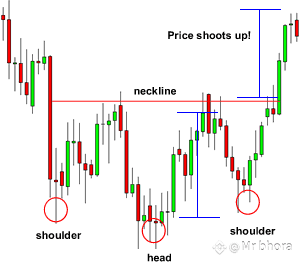
3. Bull Flag (Bullish Continuation)
Price pumps up strongly, then moves sideways or slightly down in a small channel.
Breakout above the flag = continuation of uptrend.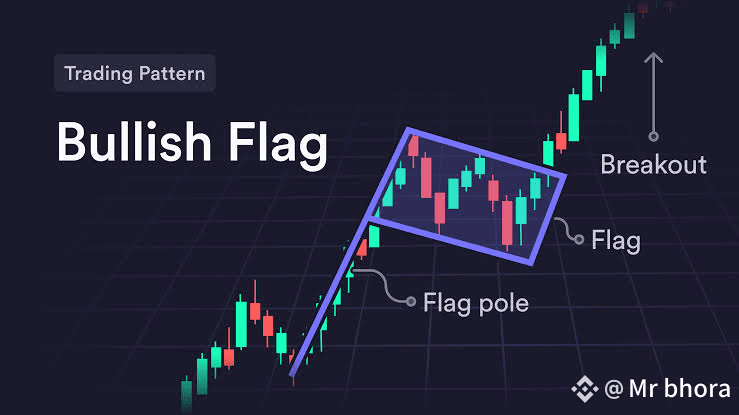
4. Bear Flag (Bearish Continuation)
Price drops sharply, then consolidates upward in a small channel.
Breakout downwards = continuation of downtrend.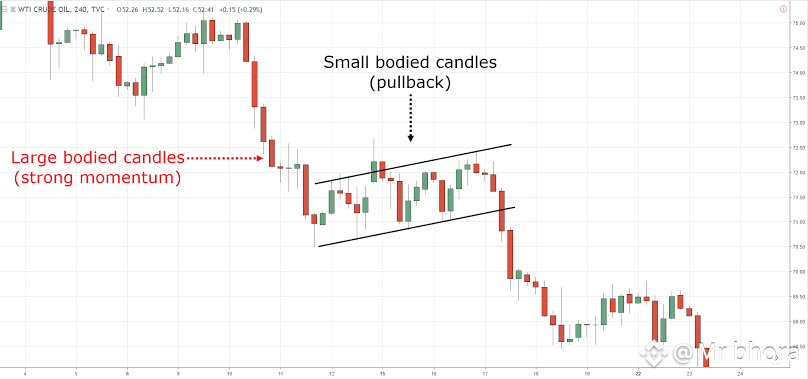
5. Ascending Triangle (Bullish Continuation)
Price makes higher lows, but faces same resistance at the top.
Once resistance breaks, strong upward move usually follows.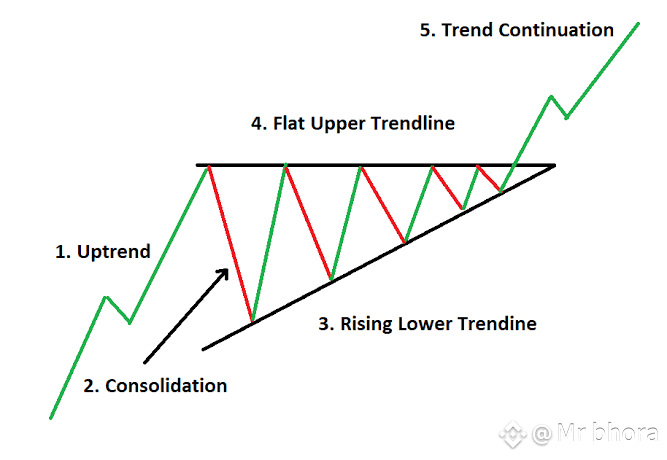
6. Descending Triangle (Bearish Continuation)
Price makes lower highs, but support holds at the bottom.
Once support breaks, price usually falls more.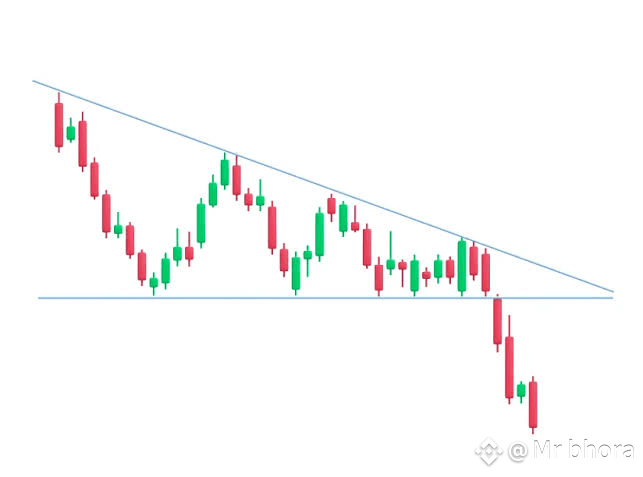
7. Double Bottom (Bullish Reversal)
Price tests the same support level twice (looks like “W”).
If it breaks above neckline, it confirms bullish reversal.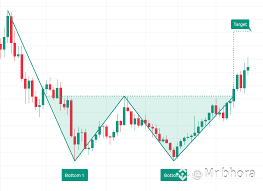
8. Double Top (Bearish Reversal)
Price tests the same resistance level twice (looks like “M”).
If it breaks below neckline, bearish reversal starts.