When I first started trading, I was just like any beginner—confused, nervous, and scared of losing money. I only had $25 in my trading account, and honestly, I thought it would disappear in a few bad trades. But instead of rushing, I decided to learn. I discovered something that completely changed my journey: chart patterns.
Chart patterns are like the “language” of the market. Once you understand them, you can almost see what the price wants to do next. It’s like reading a story on a chart. And with these patterns, I slowly grew my $25 into more than $900.
Let me share how.
Why Chart Patterns Matter
Trading is not gambling—it’s about probabilities. Chart patterns show us where buyers and sellers are fighting, and who might win. When you spot the right pattern at the right time, your chances of success increase.
For me, these 15 patterns became my trading compass.
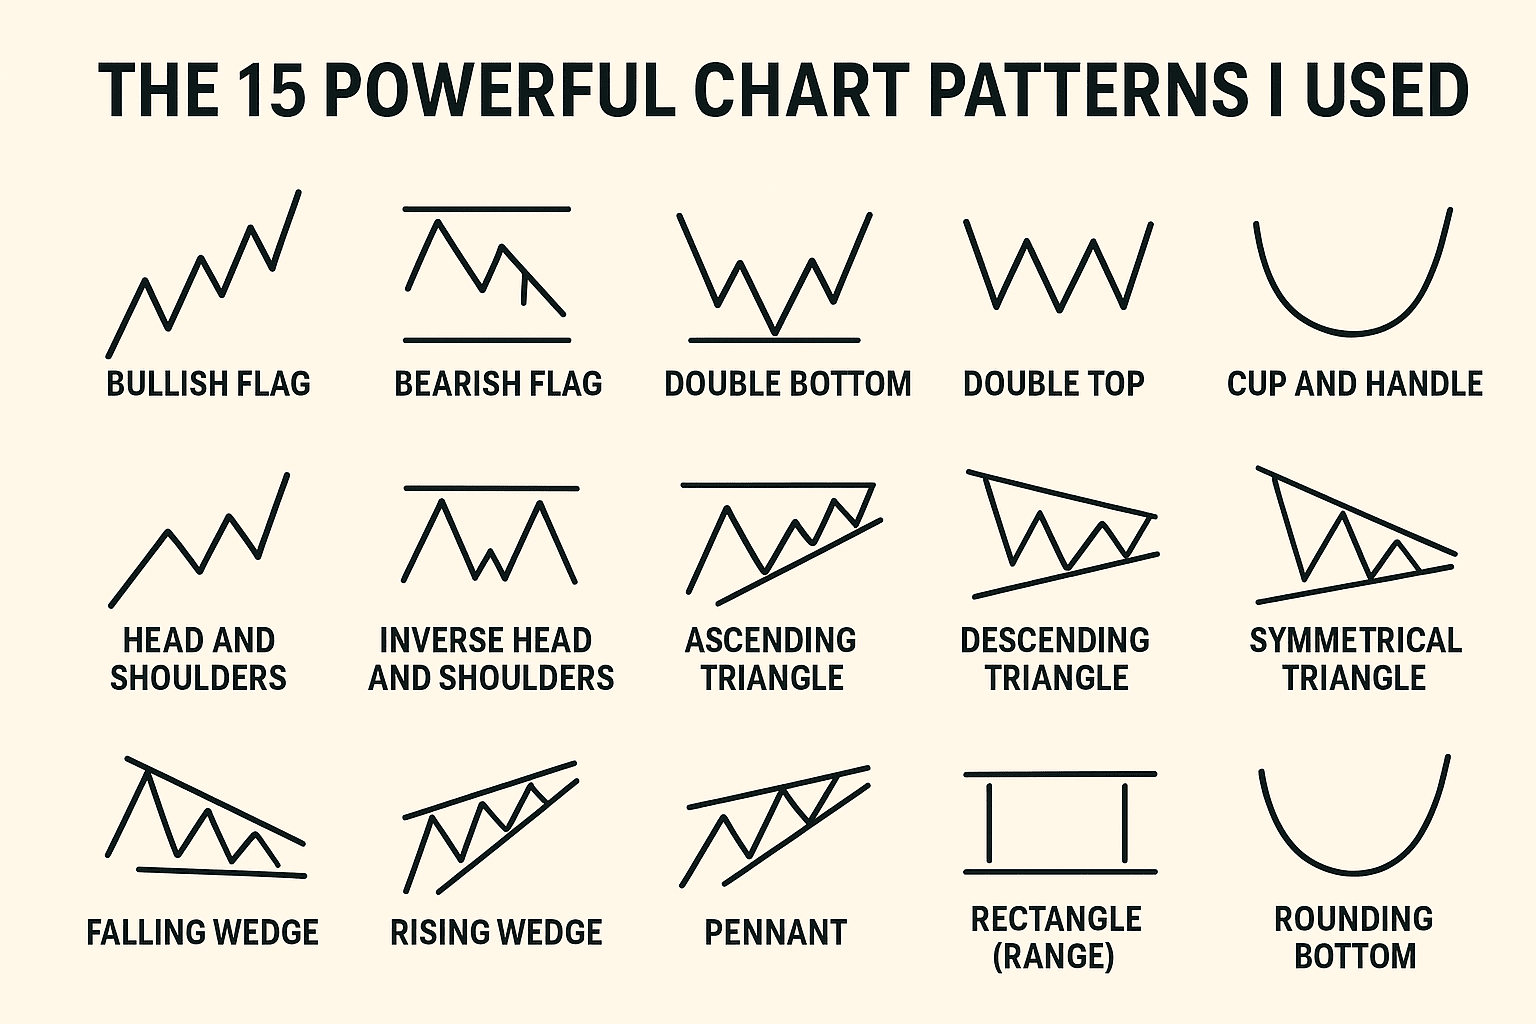
The 15 Powerful Chart Patterns I Used
Here are the patterns that guided my trades, explained simply:
Bullish Flag – A strong push up, then a small pause. It often means price will go higher.
Bearish Flag – Same as above but in reverse. A drop, a pause, then more downside.
3.Double Bottom – Price touches the same low twice and bounces up. A sign of reversal.
4.Double Top – Price hits the same high twice and falls. A warning of reversal down.
5.Cup and Handle – A rounded bottom with a small dip (handle). Very bullish pattern.
6.Head and Shoulders – A peak in the middle, with two smaller peaks on sides. Usually bearish.
7.inverse Head and Shoulders – The opposite of above, often bullish.
8.Ascending Triangle – Flat top, rising bottom. Buyers are stronger here.
9.Descending Triangle – Flat bottom, falling top. Sellers are in control.
10.Symmetrical Triangle – Both sides squeeze in. A breakout is coming soon.
11.Falling Wedge – Sloping down but narrowing. Often breaks upward.
12.Rising Wedge – Sloping up but narrowing. Often breaks downward.
13.Pennant – Like a flag but smaller. Usually continues in the same direction.
14.Rectangle (Range) – Price moves sideways between support and resistance. A breakout follows.
15.Rounding Bottom – A slow curve that leads into an uptrend.
My Strategy with These Patterns
I didn’t trade every pattern I saw. I waited for:
1.Confirmation – I made sure price broke out before entering.
2.Volume Check – High volume meant strong moves.
3.Stop Loss – I always placed a stop to protect my money.
4.Small Steps – I started with tiny trades. Even a few cents in profit mattered.
Over time, these small wins added up. I reinvested profits, avoided greed, and stayed patient.
Lessons I Learned
Discipline beats excitement – Patience brought me more gains than rushing.
🌟Losses are teachers – I lost many trades, but I used them to learn, not to quit.
🌟Consistency is key – One big win doesn’t make you successful, but steady growth does.
Final Words
Turning $25 into $900+ wasn’t magic. It was about learning, practicing, and respecting the market. Chart patterns gave me a map, but discipline kept me on the path.
If you’re starting small, don’t feel discouraged. Even a tiny account can grow with the right knowledge and patience. Master these patterns, stay calm, and let the charts guide you—your $25 could also turn into something much bigger.