On August 24, Bitcoin [BTC] fell below $112,000. This was not just another drop; it triggered significant risk-off sentiment.
This move was quickly confirmed, with nearly $600 million in actual losses flooding the market the next day, marking the largest single-day loss of the month.
What are the consequences? Subsequently, $475 million worth of long positions were liquidated, marking the most severe washout for leveraged longs since the panic and uncertainty (FUD) triggered by tariffs in April.
In short, breaking through a support level is enough to trigger a significant rally; currently, $110,000 is the key line on the chart.
Bitcoin's fragile market structure is laid bare!
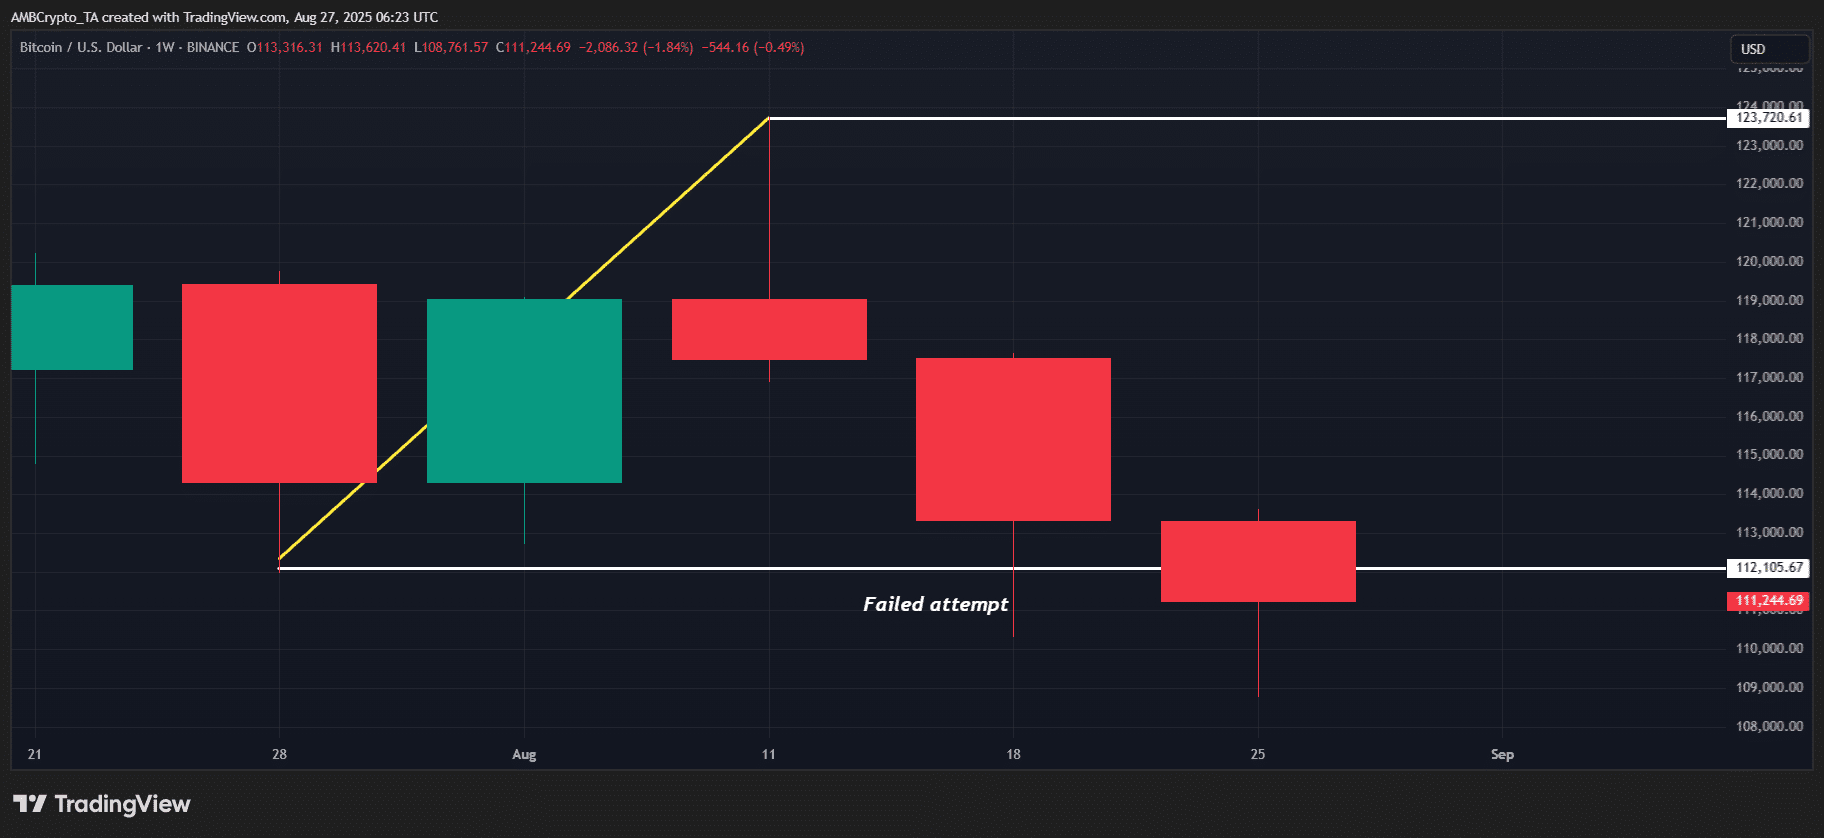
Just look at Bitcoin's chart to see why $112,000 is so important.
On August 2, BTC retested this support level after reaching a high of $123,000 twenty days ago, and has since risen 10.7% over two weeks, setting a new historical high.
However, when the next retest failed to bring a similar rebound, the market structure turned bearish. A real loss of $600 million confirmed this, as holders with a higher cost basis exited.
 What was the result? Bitcoin fell to new lows for three consecutive trading days.
The first wick touched $110,305, the second wick touched $110,185, and the third wick fell to $108,761. This naturally put pressure on the short-term support level, prompting shorts to target liquidity positions just below $110,000.
In short, BTC holds firm at $110,000, which is its last line of defense in the near term. If this level fails, it could further drop to the $107,000 to $105,000 range, where stronger buying interest may emerge.
Without macro stimulus, BTC could drop to $100,000.
As of the time of writing, the Cryptocurrency Volatility Index (CVI) is at 47.69, indicating moderate market volatility.
Even after the market closed, panic did not emerge. The Fear and Greed Index remains neutral at 47, up 4 points from yesterday.
Spot ETFs have also turned positive, indicating that stable buying support levels are slowly recovering. Meanwhile, open interest (OI) remains low, suggesting that leverage has not yet returned.
Most importantly, this keeps BTC structurally bearish—though any rebound could quickly reverse this bias.
Funds are flowing into ETH, not BTC.
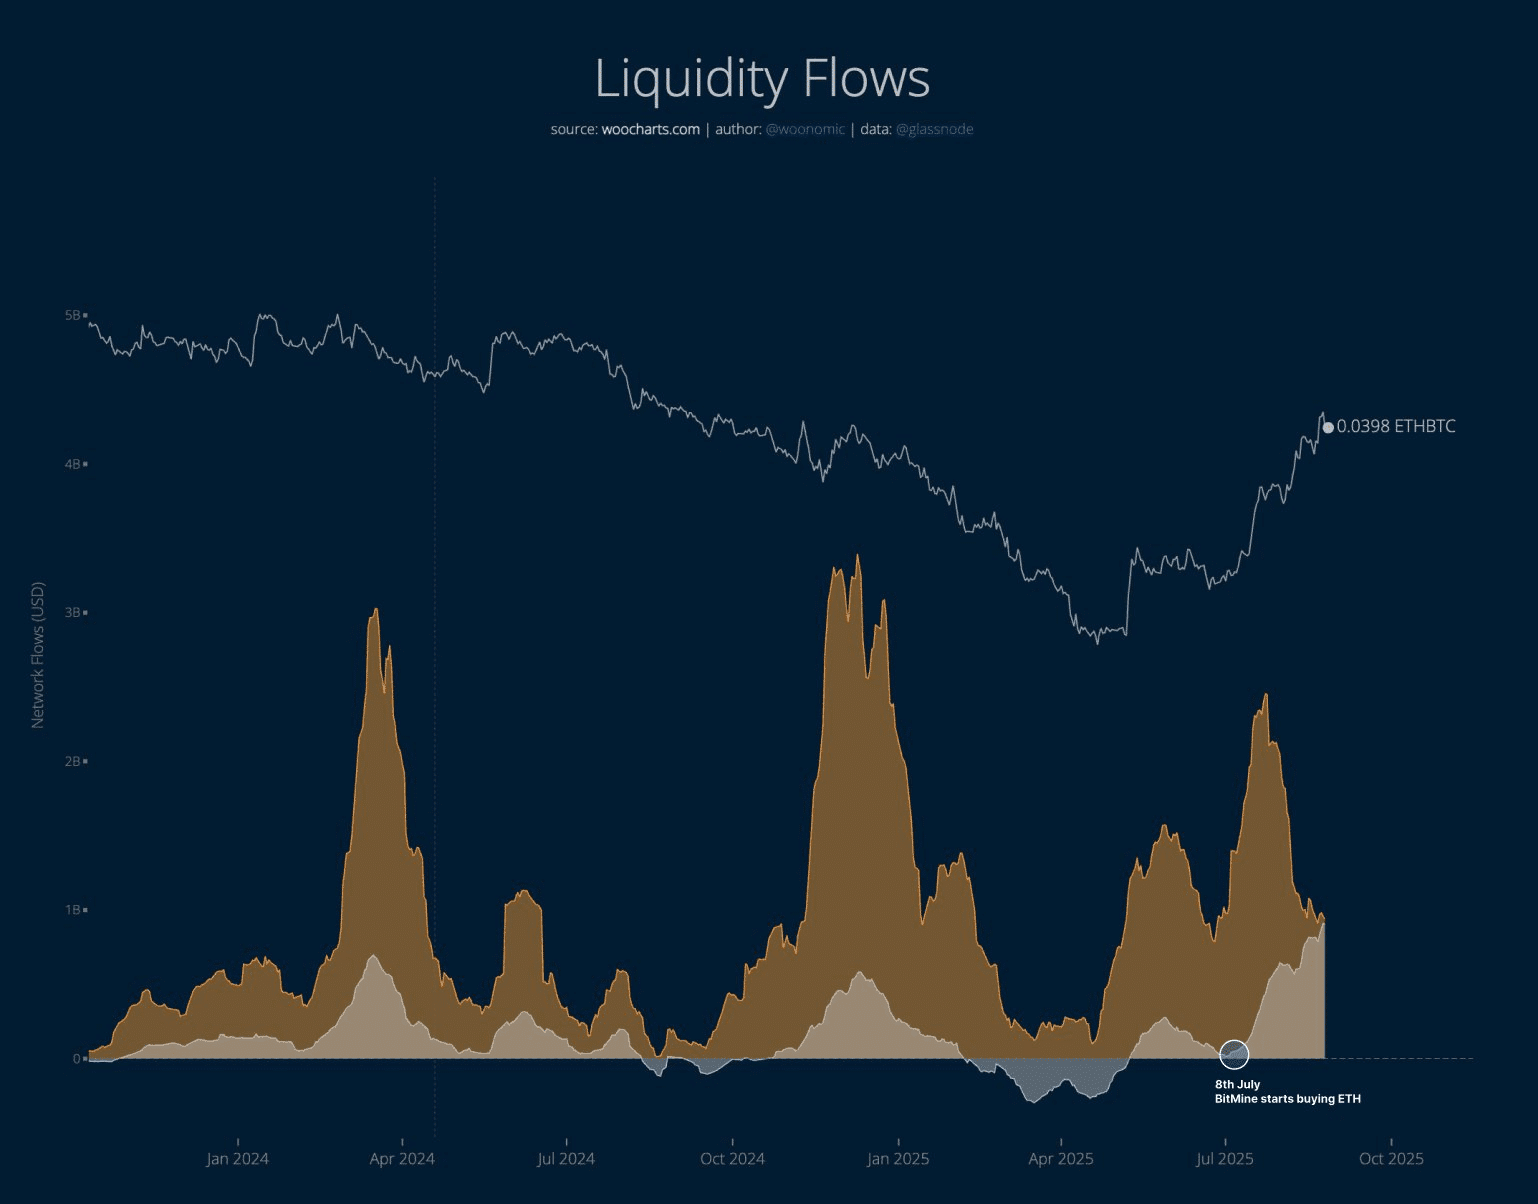 However, one major resistance Bitcoin faces is the ETH/BTC ratio.
The inflow for Ethereum [ETH] is about $900 million per day (in silver), currently catching up to BTC's inflow (in orange).
Additionally, while BTC ETFs have turned positive, ETH ETFs have raised over $1 billion in the last four trades, indicating capital is actively shifting to ETH.
That said, unless the Federal Reserve shifts towards macro catalysts, whales may continue to divert safe-haven funds to Ethereum, increasing the risk of Bitcoin further dropping to $100,000.


