[Bubblemaps: Unlocking a New Perspective on On-Chain Capital Networks and Investment Strategies]
In the Web3 world, on-chain transaction data is exploding daily. Whether it's DeFi, NFT, GameFi, or DAO, each transaction leaves a trace, but how to quickly discover value from this vast amount of information is a long-standing pain point for investors and projects. The emergence of Bubblemaps aims to solve this problem—it not only provides visualization but also clarifies on-chain capital networks, user behaviors, and investment strategies.
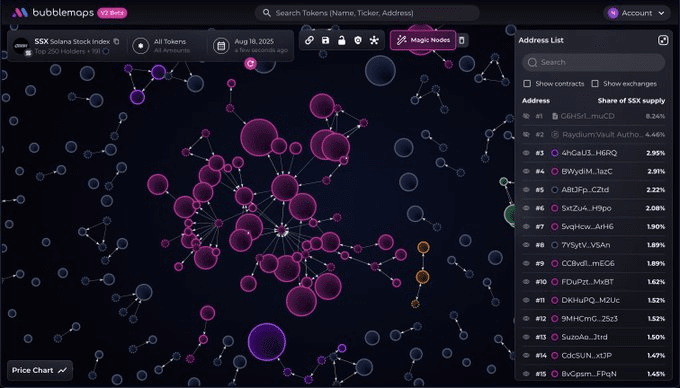
One, Capital Flow Network: Understanding the On-Chain 'Main Arteries'
In traditional financial markets, capital flows are often assessed through reports, transaction data, or news analysis, but on-chain, all capital movements are transparent and traceable. The issue is that this data is fragmented, vast, and complex; without visualization tools, you can hardly see the 'context.'
The core advantage of Bubblemaps is transforming these massive transaction data into intuitive capital flow network diagrams. In the diagram, each address can be represented as a node, each capital movement forms a line, with the thickness of the line representing the transaction amount, and the color of the node representing activity level or category.
For example:
You can easily see which major holders primarily concentrate the funds of a DeFi project.
You can track the flow of funds from early retail investors to core investors in NFT series.
You can analyze the inflow and outflow of cross-chain capital and discover trends in capital migration between different ecosystems.
This visualization not only makes data intuitive but also provides a basis for investment decisions. Investors no longer blindly follow trends but can make strategic adjustments based on actual capital flows.
Two, Investment Strategy Optimization: Discovering Opportunities from Charts
The core of investment strategy is to discover capital movements and behavior patterns. The tools provided by Bubblemaps make this process visual and quantifiable.
Analysis of capital concentration and dispersion
If capital is highly concentrated in a few nodes, it indicates that the market may be dominated by a few large holders, leading to higher volatility risks.
If capital distribution is even, it indicates a high market health, high retail participation, and relatively controllable investment risks.
Monitoring inflow/outflow trends
Bubblemaps can display capital flow hotspots in real-time, allowing investors to first discover new projects with concentrated capital inflows.
At the same time, it can also identify situations of rapid capital outflow, helping to avoid potential downward risks.
Cross-project capital correlation analysis
Bubblemaps can display the intersection of different project capital flow networks, allowing investors to discover potential arbitrage opportunities or strongly related projects within the ecosystem.
By analyzing the sources of funds, core investors and potential strategy patterns can be identified, thus optimizing asset allocation.
Through these features, Bubblemaps is not just a data visualization tool but also an essential tool for investors to formulate strategies and manage risks.
Three, Cross-Chain Ecological Analysis: Bridging Multi-Chain Perspectives
With the development of multi-chain ecosystems, users and funds are increasingly dispersed across different chains. A single-chain perspective can no longer comprehensively reflect market patterns. Bubblemaps provides tremendous value in this regard.
Multi-chain capital flow visualization
Whether funds flow from Ethereum to Solana, or from Binance Smart Chain to Polygon, it can be intuitively presented in Bubblemaps.
Investors can clearly see the trends in cross-chain capital flows, providing decision-making support for cross-chain arbitrage or liquidity deployment.
Cross-chain user behavior analysis
User behavior is not limited to a single chain; cross-chain active users may be the true 'core players' in the market.
Bubblemaps can identify these cross-chain active users, providing project parties with precise community operation strategies.
Ecological collaboration opportunity discovery
Through cross-chain capital flow and user network analysis, project parties can discover potential partners and ecological collaboration opportunities.
This not only aids project growth but also enhances the efficiency and connectivity of the entire ecosystem.
Four, Real-time Monitoring and Risk Management
In Web3, risk management is a prerequisite for any investment and operational decision. The real-time monitoring capabilities provided by Bubblemaps enable users and project parties to identify risk points in advance.
Abnormal transaction detection: through capital flow network diagrams, investors can quickly identify abnormal capital accumulation or transfers.
Project health evaluation: observing core node capital flows to determine whether the project is at risk of manipulation.
Portfolio adjustment: timely adjusting asset allocation based on real-time capital flows to avoid concentration risks.
This capability is crucial in high-volatility market environments, allowing users to make scientific decisions based on transparent data and visualized behaviors.
Five, Technical Architecture and Scalability
Bubblemaps can achieve these capabilities, backed by an advanced technical architecture.
Multi-chain data fetching engine: supporting mainstream chains such as Ethereum, BSC, Polygon, and Solana.
High-performance graphic rendering: even when facing millions of nodes, it can quickly respond to user actions.
Interactive analysis tools: supporting filtering, clicking, tracking, and historical comparative analysis.
Open API and ecological support: allowing third-party developers to build data applications based on Bubblemaps, forming a rich ecosystem.
This architecture ensures Bubblemaps' stability and flexibility in the face of data explosion and multi-chain expansion.
Six, Application Cases and Practical Value
Investor insights
When an NFT series is just launched, Bubblemaps can display the flow of funds, core buyers, and transaction concentration, allowing investors to quickly assess project potential.
Project growth
The project team can identify core users, analyze capital distribution, and optimize the reward mechanism, thereby enhancing user retention and activity.
Cross-chain strategy
For cross-chain DeFi products, Bubblemaps can reveal capital flow patterns across chains, helping to optimize liquidity deployment.
Risk management
By monitoring abnormal capital flows and core node movements in real-time, both users and project parties can detect potential risks in advance.
Seven, Future Outlook
As the Web3 ecosystem continues to expand, the scale and complexity of on-chain data will only increase. The potential of Bubblemaps is also continuously amplified.
Intelligent analysis and prediction: combining AI technology to forecast capital flow trends and investment opportunities.
Comprehensive on-chain perspective: achieving cross-chain ecosystem visualization and providing users with a unified analysis platform.
Ecological collaboration and governance support: providing scientific decision-making basis for DAOs and multi-project ecosystems.
Open platform: supporting the developer ecosystem, forming a closed loop of data visualization and strategy analysis across the entire chain.
It is foreseeable that Bubblemaps is not only an on-chain data visualization tool but also the core hub for Web3 investment decision-making and ecosystem management.
Eight, Conclusion
In the Web3 world, data transparency does not equal information usability. What Bubblemaps does is make on-chain data visualized, understandable, and actionable.
For investors, it is a powerful tool for discovering opportunities, optimizing strategies, and managing risks.
For project parties, it is a strategic tool for growth, user insights, and ecological collaboration.
For the entire Web3 ecosystem, it is an engine for the transparency of capital flow networks and user behaviors.
The emergence of Bubblemaps makes the on-chain world no longer just cold numbers, but a lively ecosystem that can be understood, analyzed, and decided upon. It is redefining Web3.
Data analysis standards that enable everyone to see, understand, and utilize in this ecosystem, and grasp the future.
