
Author: @BlazingKevin_, the Researcher at Movemaker.
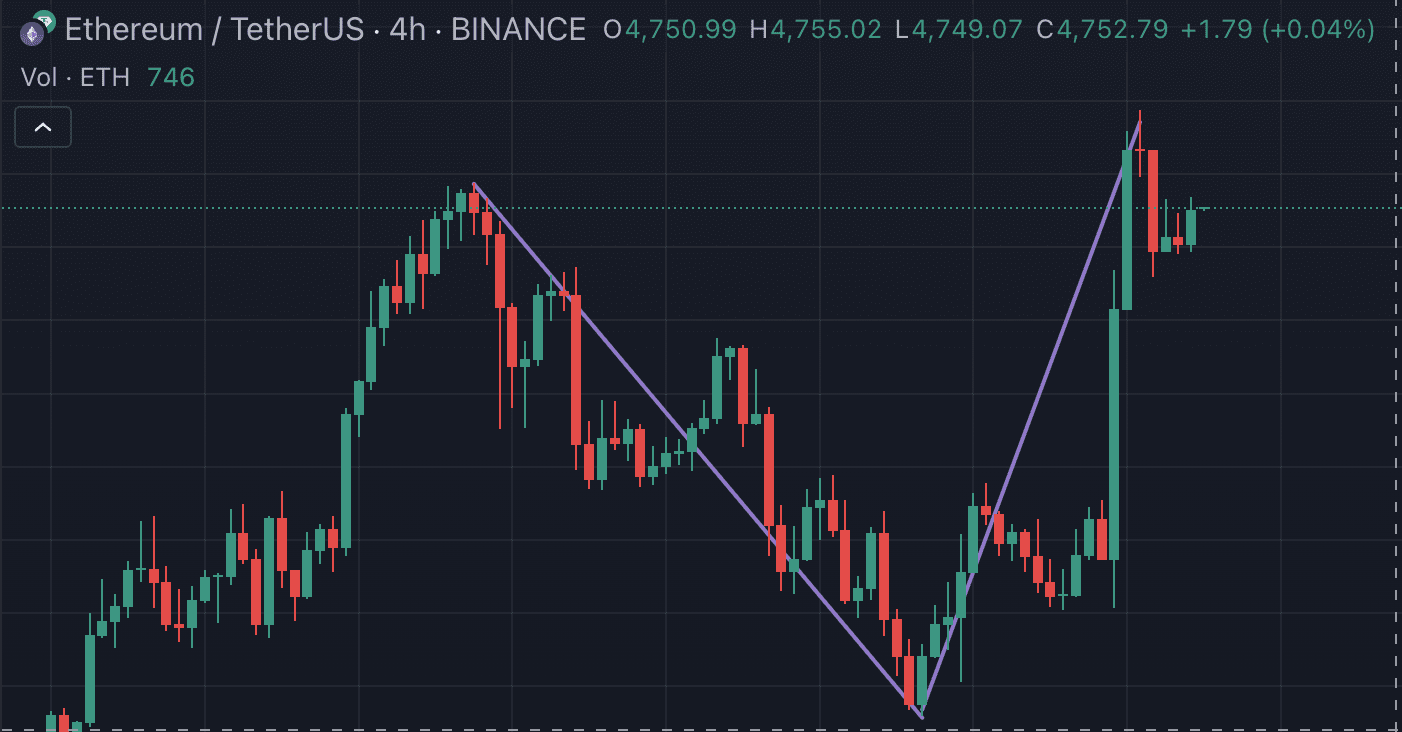
As Ethereum broke through 4868, it officially reached a new historical high. Looking back at the market trends of the past two weeks: Ethereum experienced a roller coaster, fluctuating between 4788-4060-4887, completing a 15% drop and a 20% rise in 10 days. Meanwhile, the institutions driving this round of Ethereum's market, namely the Ethereum MicroStrategy's stock price, also experienced a roller coaster.
If your portfolio includes Ethereum and its leveraged institutional stocks, and you anticipate that Ethereum will undergo wide fluctuations at historical highs, the importance of using derivatives to hedge against account drawdown risks is continually increasing. Even if you are a long-term holder who believes in 'buy and hold', you may not want to experience another prolonged downward fluctuation like Bitcoin did last year.
Options, as a nonlinear financial derivative, provide an effective solution for managing this price risk. By purchasing put options, you can set a price floor for the ETH or related cryptocurrency stock assets you hold, thereby protecting the value of your portfolio during significant market downturns. Furthermore, by constructing more complex options combinations, you can even profit during market sideways or slight fluctuations.
How should we go long on mNAV if we are optimistic about the further expansion of the flywheel?
Ethereum's DAT Ponzi flywheel continues.
The DAT (Digital Asset Treasury) strategy has allowed Michael Saylor's company to surpass a market value of 100 billion dollars, with its growth even exceeding that of NVIDIA during the same period. By issuing company securities (such as stocks or bonds) to raise funds in the public market and using that capital to significantly increase holdings of cryptocurrency, the aim is to create a positive cycle of 'raising funds -> buying coins -> both coin price and stock price rise -> raising funds again.'
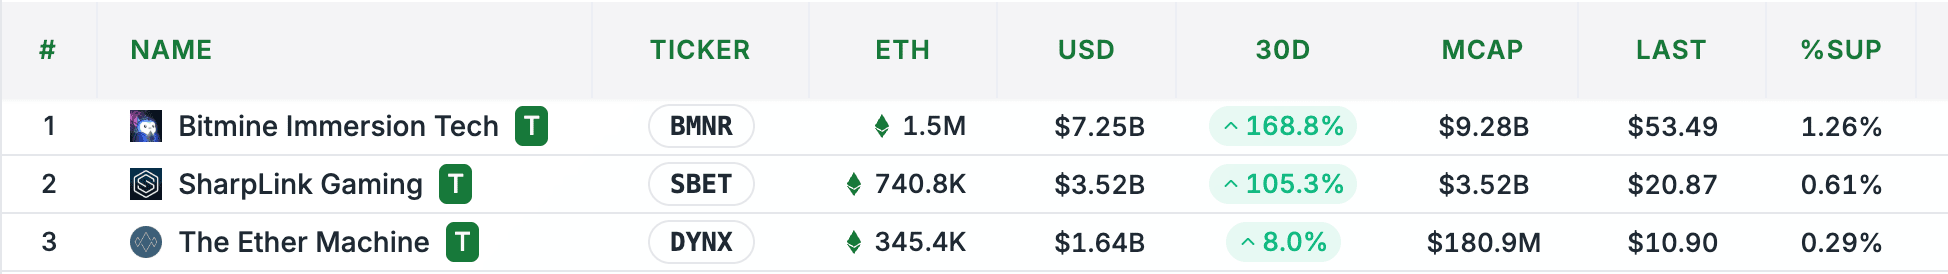
Companies represented by Sharplink Gaming (SBET) and BitMine (BMNR) are trying to replicate and upgrade this model, while Ethereum's unique properties may enable this flywheel to turn faster and more steadily.
The essence of the DAT model is an arbitrage game about the long-term growth rate of assets versus the cost of financing. Its success hinges on the long-term compound annual growth rate (CAGR) of the underlying assets (like ETH) being significantly higher than the company's cost of capital. However, the uniqueness of the Ethereum treasury lies in its not simply replicating Bitcoin's script, but cleverly leveraging three unique characteristics of the Ethereum ecosystem to inject unprecedented driving force into this flywheel model.
1. Volatility becomes the 'catalyst' for financing.
In traditional thinking, high volatility usually means high risk. However, in the financing tools of the DAT model—especially the issuance of convertible bonds (CB)—Ethereum's historical and implied volatility far exceeds that of Bitcoin, becoming a unique advantage. This high volatility poses a huge attraction for hedge funds that thrive on trading volatility (such as those engaged in Gamma trading). As a result, ETH treasury companies can issue convertible bonds under more favorable conditions (higher valuations), thereby reducing financing costs. Volatility here is no longer merely a risk but transformed into a 'bait' to attract specific institutional investors, thus providing cheaper and more abundant fuel for the initiation of the flywheel.
2. Native returns provide an inherent 'stabilizer.'
Bitcoin treasuries (such as MSTR) rely on issuing stocks in the market to exchange for cash for debt interest or preferred stock dividends, heavily depending on market liquidity and the stability of stock prices. Ethereum's PoS mechanism endows ETH with inherent productivity—i.e., through staking and re-staking, it can generate stable and considerable native returns. This means ETH treasury companies can use these returns to cover the interest costs of their financing tools, significantly reducing their dependence on the market.
3. The mNAV premium constitutes the 'accelerator' of the flywheel.
The ratio of market value to net asset value (mNAV) is a key indicator for measuring the valuation of treasury companies, reflecting the market's expectations for their future value-added capabilities. Since the native income mechanism of ETH can continuously increase the corresponding ETH amount per share without relying on additional financing, the market naturally tends to give ETH treasury companies higher mNAV premiums. The higher the mNAV, the stronger the value-added and acceleration effects of the flywheel.
The correct posture for going long on mNAV while ignoring the price fluctuations of individual cryptocurrencies.
If your current strategy is optimistic about mNAV and you believe Ethereum may have a risk of a pullback, then ignoring the price fluctuations of individual cryptocurrencies is the most appropriate options strategy. Taking BMNR as an example, you might think that going long 10,000 BMNR and shorting 10,000 ETHA can simply achieve this. However, this is actually an incorrect hedging strategy.
When only going long on mNAV, we need to consider the intrinsic value per share of BMNR, SBET, ETHA, etc. That is, how many units of ETH each share actually represents. This can be viewed as the 'net asset value' of the tool priced in ETH.
Calculation method: Amount of ETH per share = Total ETH holdings / Total number of shares issued.
For ETHA, its calculation process is as follows: First, the calculation method for the indicative basket of Ethereum quantity for a certain day is: multiply the estimated net asset value (NAV) for the next day by the number of shares in each basket (40,000), then divide by the day's CF benchmark index.
According to the data from https://www.ishares.com/us/products/337614/ishares-ethereum-trust-etf, 40,000 shares correspond to 302.56 Ethereum.
302.57/40000=0.00756 ETH.
That is, 1 ETHA = 0.00756 ETH.
For BMNR, its calculation process is as follows:
Number of circulating shares: 173,496,950 shares.
Amount of ETH held: 1,570,000.
That is, 1 BMNR = 0.00904 ETH.
After determining the 'ETH content' of the two assets, the next step is to calculate the hedging ratio:
BMNR:ETHA = 0.00904:0.00756 = 6:5.
According to the closing price: 1ETH = 4840.
The intrinsic value of 1 BMNR is: 0.00904*4840 = 43.75.
The closing price of BMNR is 53.49.
BMNR's mNAV = 53.49/43.75 = 1.22.
Using the same algorithm, calculate SBET's mNAV: Number of circulating shares: 168,866,724 shares, 740,800 ETH gives: 1 SBET = 0.00438 ETH.
According to the closing price: 1ETH = 4840.
The intrinsic value of 1 SBET is: 0.00438*4840 = 21.19.
The closing price of SBET is 20.87.
SBET's mNAV = 21.19/20.87 = 1.015.
The hedging ratio of SBET to ETHA is: SBET:ETHA = 0.00438:0.00756 = 11:19.
SBET's mNAV is less than that of BMNR. When Ethereum approaches historical highs, there is a considerable possibility of a pullback or entering wide fluctuations. Following the operational thought of this section, we still remain optimistic that the mNAV flywheel will continue to operate positively, meaning neither SBET nor BMNR should fall below their intrinsic values before expiration, yet we do not want to bear the risk of sharp pullbacks in Ethereum leading to net value shrinkage. Therefore, we should anticipate that the decline in ETH will exceed that of SBET or BMNR. Choose the one with smaller mNAV between SBET and BMNR to go long, minimizing risk.
Taking 250905 as an example:
We should operate with the same proportion of selling SBET puts and buying ETHA puts: Selling SBET 20.5 PUT*19 yields a premium of $2,888.
According to the intrinsic value of SBET, the drop is: 3.2%.
The price of ETHA experiencing the same drop is: 35.39.
The closest strike price is 36, so ETHA buys 35PUT*11, paying a premium of $1,507.
Premium income is: $1,381.
If mNAV rises or remains unchanged, then gain premium income. However, if SBET's decline exceeds that of Ethereum, i.e., mNAV declines, then losses will occur. According to SBET's current premium level, this situation means the premium enters underwater, and the DAT flywheel may be pressed to pause.
Therefore, the configuration idea of this strategy should be: Be optimistic that this round of Ethereum's market has not ended, meaning mNAV should steadily rise, but believe that Ethereum may have a short-term pullback. Thus, aiming to go long on mNAV while ignoring the price changes of individual cryptocurrencies. Of course, this strategy also has drawbacks, as a sharp drop in ETH may lead to market expectations of 'issuance flywheel failure,' and SBET's stock price often falls more sharply than ETH. In such extreme cases, the Put seller's exposure will suffer significant losses, and the ETHA Put hedging may be insufficient. Alternatively, if market sentiment turns negative (expecting issuance failure, long pullback cycles for ETH), premiums may enter underwater and continue to decline.
When the cryptocurrency stock issuance leads to a decline in premium, how should we short mNAV?
For businesses like SBET and BMNR, which are fundamentally about holding and increasing ETH, their stock price performance not only depends on the price of ETH but is also profoundly influenced by the company's own capital operations, the most crucial of which is the circular model of financing through issuing new shares to buy more ETH. In a bullish market where ETH prices continue to rise, this model seems to create value, but it hides a continuous dilution of existing shareholder rights. This dilution effect is mathematically inevitable and will ultimately undermine its 'eternal growth' logic.
The core mechanism of equity dilution.
To truly understand the operational logic of equity dilution, one can start from a quantitative deduction framework. Its basic starting point is that issuance means that the corresponding assets of the same company have to be shared by more shares. Unless the market reacts ideally (i.e., willing to accept additional supply while maintaining valuation), the relative equity of old shareholders will inevitably be weakened, and the essence of new capital entering is a reallocation of value among shareholders.
Initial settings:
Company holdings: Assume the company has a portfolio of AI startup equity worth 200 million dollars, with no debt, so the net asset value (NAV) is 200 million dollars.
Market value: The market gives it a valuation of 250 million dollars, reflecting a 25% premium. This premium may stem from the market's fervent pursuit of the AI track or its high expectations for the company’s investment vision.
Share capital size: Set to Q shares.
Net asset value per share (NAV): 200/Q dollars.
Price per share: 250/Q dollars.
The market is willing to pay $1.25 to purchase every $1 worth of assets held by the company; this 25% premium is the 'fuel' that can kick off subsequent issuance cycles.
First increase:
Financing scale: The company decides to raise 100 million dollars by issuing new shares, using all the funds for investment in new AI projects. To maintain market price stability, the issuance must be conducted at the current stock price of 250/Q dollars.
New number of shares (M): M=100 million ÷ (250/Q) = 0.4Q shares.
Total new share capital: Qnew=Q+M=Q+0.4Q=1.4Q shares.
Total new asset amount: Anew=200 million+100 million=300 million.
New net asset value per share: NAVnew=300 million ÷ (1.4Q) ≈ $214.29/Q dollars. Compared to the original 200/Q, the intrinsic value per share has indeed increased.
New market value (assuming stock price remains stable): Market value new=(250/Q)×1.4Q=350 million.
New premium: Premium new=(350 million ÷ 300 million)−1≈16.67%.
On paper, net asset value increases, stock price remains unchanged, and company market value significantly expands. However, in essence, the original 25% premium has been diluted to 16.67%.
How value transfer occurs:
The newly injected 100 million dollars in assets is now jointly owned by all shareholders (new and old). The old shareholders' ownership ratio has decreased from 100% to Q/1.4Q ≈ 71.43%.
Their equity in the total new asset amount of 300 million is approximately 300 million × 71.43% ≈ 214 million. Although this is $14 million more than their initial $200 million assets, they lose part of the claim to the original high premium. New shareholders, with $100 million, not only acquired $100 million worth of assets but also 'freely' enjoyed part of the market premium of the entire company, equivalent to entering at a discount.
If the cycle continues:
Assuming the company continues to adopt this strategy, raising funds equivalent to 40% of the current market value each time:
After the first round: Assets 300 million, market value 350 million, premium 16.67%.
Second round: Refinance 140 million (40% of 350 million), total assets will become 440 million, while the new market value (if stock price remains unchanged) will reach 490 million, and the premium will be further diluted to about 11.36%.
After the third round: Asset scale continues to expand, but the premium will continue to decline.
As rounds increase, the premium will approach 0. Ultimately, when the issuance price can only equal the net asset value per share:
Net asset value per share will no longer increase. For example, if assets are K and equity is P. At this point, the issuance can only be conducted at K/P price. If 0.3K is raised, the new number of shares will be 0.3P. New assets are 1.3K, new equity is 1.3P, resulting in a net asset value of (1.3K)/(1.3P)=K/P, which is exactly the same as before the issuance.
The 'magic' of issuance becomes ineffective. Without premium space, new issuance no longer has the superficial effect of enhancing the net asset value per share, and the game between old and new shareholders becomes a purely zero-sum game.
Why this effect is inevitable:
The market will not always cooperate: Investors will conduct valuation analyses, and once they realize that the company's growth relies solely on external blood transfusions rather than intrinsic profitability, the premium offered by the market will quickly shrink, leading to a drop in stock prices, thus undermining the premise of 'issuing shares at market price.'
Dilution is an arithmetic inevitability: Unless the company can generate returns far exceeding the market average rate of return (g) with new funds, and that rate of return can consistently outperform the dilution rate of equity, dilution is an inevitable mathematical result from the perspective of long-term shareholder value.
Ultimately, it can be seen that although the issuance process may be temporarily obscured by the glories of 'asset scale amplification' and 'underlying asset appreciation,' its core is that the rights of old shareholders are gradually ceded to new shareholders, who share the past accumulated value and premium of the company at a lower cost. The larger the proportion of financing scale relative to market value, the faster this dilution effect occurs.
Strategy for shorting mNAV: Expecting that BMNR's increase will be less than ETHA due to dilution from issuance.
Based on this, what strategy should you formulate? First, we are optimistic about the continuation of the bull market, so this is an offensive protective strategy for the upcoming increase of BMNR.
We think when its stock price performs worse than Ethereum itself, and we need a strategy that can hedge against Ethereum's price fluctuations while purely shorting its mNAV.
Simply shorting BMNR and going long ETHA is a directional bet, but not precise enough. To accurately short mNAV, we need to use options and strictly adhere to its intrinsic value per share (in ETH) for hedging.
Step one: Calculate the intrinsic value per share.
We need to reuse the previous calculations to determine the 'net asset value' (NAV) of the two assets priced in ETH.
The ETH content of ETHA: According to data from the iShares official website, 1 ETHA ≈ 0.00756 ETH.
The ETH content of BMNR: Based on its ETH holdings (1,570,000) and the number of circulating shares (173,496,950), 1 BMNR ≈ 0.00904 ETH.
Step two: Determine the hedging ratio.
To isolate the impact of ETH's price changes in trading, we must calculate the hedging ratio based on their 'ETH content.'
Hedging ratio:
BMNR:ETHA=0.00904:0.00756≈1.2:1≈6:5.
This means that, in terms of intrinsic value, 6 shares of BMNR are approximately equivalent to the Ethereum value represented by 5 shares of ETHA.
Step three: Build the options strategy to short mNAV.
Our goal is:
Betting that BMNR's price performance will be weaker than its intrinsic value.
Hedging against ETHA's price fluctuations.
Therefore, the correct operation should be to buy BMNR put options and sell ETHA put options.
Buy BMNR PUT: This is the core of our strategy. If the BMNR stock price drops or the increase is not as expected, this position will profit.
Sell ETHA PUT: This is the source of hedging and funding costs. We sell ETHA PUTs, collecting premiums, expressing our view that 'we do not believe ETHA will perform worse than BMNR.' This operation hedges against the overall downside risk of the ETH market. If ETH does not drop significantly, this position will profit through premium collection.
Taking the options with a strike price of 250905 (expiration on September 5, 2025) as an example:
Assuming current prices: BMNR = $53.49, ETHA = $36.5 (based on $4840/ETH * 0.00756).
We should operate at a ratio of 6:5:
Buy BMNR PUT: Choose a strike price near the money, for example, buying 6 contracts of BMNR $53 PUT. The premium paid is $5.00 per contract, with total expenditure being $5.00 * 100 * 6 = $3,000.
Sell ETHA PUT: Similarly, choose a strike price near the money, for example, selling 5 contracts of ETHA $36 PUT. The premium received is $4.20 per contract, with total income being $4.20 * 100 * 5 = $2,100.
Net cost: Total strategy cost = Paid premium - Received premium = $3,000 - $2,100 = $900.
This is a net expenditure strategy, so the maximum loss is the paid $900.
Profit and loss analysis of the strategy.
Profit scenario (mNAV declines):
BMNR's increase is less than that of ETHA: ETH rises 10%, ETHA price increases from 36.5 to 40.15. Theoretically, BMNR should rise from 53.49 to 58.8. However, due to expectations of dilution from the issuance, BMNR only rises to $55. At this point, although your BMNR PUT is losing, its loss is smaller than the gain from the ETHA PUT (which has turned into worthless paper), and the relative value change makes the overall strategy profitable.
BMNR's decline exceeds that of ETHA: ETH pulls back 5%, while ETHA's price drops to 34.6. Theoretically, BMNR should drop to 50.8. However, market panic causes mNAV to contract, and BMNR falls to $48. At this point, the BMNR PUT you purchased significantly increases in value, its appreciation exceeds the loss from the sold ETHA PUT, and the overall strategy profits.
Loss scenario (mNAV rises or remains unchanged):
BMNR's increase exceeds ETHA (mNAV expansion): Market sentiment is euphoric, ETH rises 10%, while BMNR, as a high beta asset, rises 20%. At this point, BMNR PUT will become deep out of the money, worth zero, while the sold ETHA PUT will also be worthless, resulting in a total loss of net cost ($900).
ETH plummets: If the price of ETHA crashes (for example, falls below $30), the sold ETHA $36 PUT will bring substantial losses, possibly exceeding the gains from the BMNR PUT, leading to overall strategy losses.
Every strategy has a corresponding idea, and there is no perfect solution. However, once you have a judgment about the current market environment, the corresponding options combination will help you hedge risks or provide additional rewards when you make the correct judgment.

