$BB Traders, get ready! $BB is showing massive momentum, but RSI is screaming overbought! Will it pull back or blast through resistance? Time to analyze for a high-probability scalp! 🚀
📊 TECHNICAL BREAKDOWN: Bulls vs. Overbought Signals
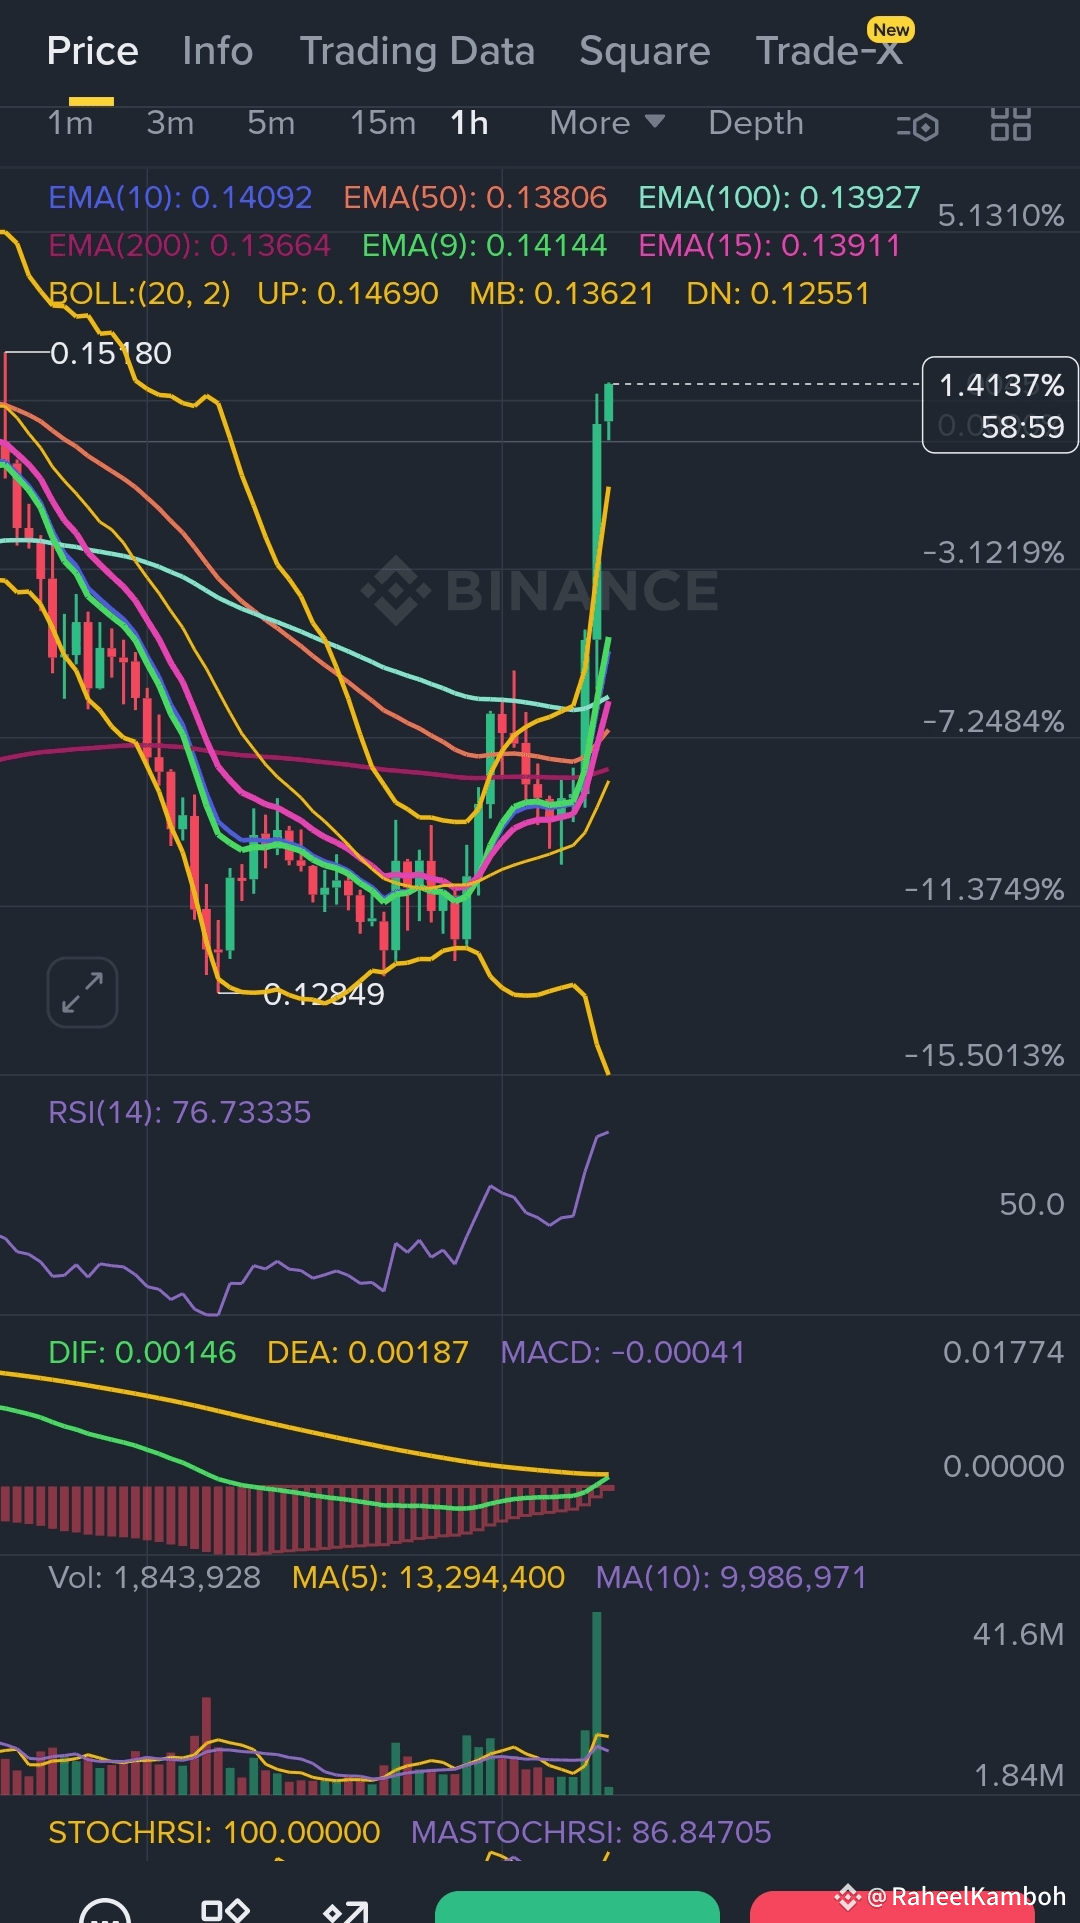
· PRICE ACTION 🎯: Price is trading strongly at $0.1504**, challenging the upper Bollinger Band. Key resistance is at **$0.1510-$0.1520** (order book shows massive Ask liquidity here). Support lies at **$0.1490-$0.1495.
· CHART PATTERN 📈: The price is in a clear ascending channel on the 15m chart. It's also testing the UPPER BOLLINGER BAND ($0.15043), a classic resistance zone.
· CANDLESTICK PATTERNS 🕯️: We are seeing strong green candles, but no clear reversal pattern yet. Watch for a Bearish Engulfing or Doji near $0.1510 for a potential short signal. For longs, a break above $0.1515 with volume is key.
· INDICATOR DIVERGENCE ⚖️: CRUCIAL!
· BEARISH DIVERGENCE: Price is making higher highs, but the RSI(14) is making lower highs (from ~86.93 to ~81.56). This is a classic reversal signal that often precedes a pullback! 🚨
· MACD: The MACD is positive but its histogram is showing signs of weakening momentum, supporting a potential downside move.
· KEY INDICATORS:
· RSI(14): Extremely overbought at 81.56 - 86.93. This is a prime zone for a technical pullback.
· Moving Averages: Price is trading well above all major EMAs (9, 10, 50, 100, 200), confirming a strong bullish trend. Any pullback could find support at the 9 EMA (~$0.1469).
· Bollinger Bands (20,2): Price is pressing the UPPER BAND. A rejection here could see a move back to the MIDDLE BAND (MB: ~$0.14325).
· Volume: Volume is strong but not climactic, suggesting the move might have more room, but the divergence is a warning.
🧠 TRADING PSYCHOLOGY 🧠
The crowd is experiencing FOMO (Fear Of Missing Out). Retail is chasing the pump at the top, while smart money might be quietly distributing. The extreme greed shown by the RSI is a classic contrarian indicator. Don't be the last one buying! 😎
🚀 SCALP SIGNAL: SHORT (Aggressive Reversal Play)
· Entry Zone: $0.1508 - $0.1512 (On a confirmed bearish rejection candle with declining RSI)
· Targets (TP):
· TP1: $0.1495 (Immediate Support)
· TP2: $0.1480 (Next Key Support)
· TP3: $0.1469 (EMA 9)
· Stop Loss (SL): HARD STOP ABOVE $0.1520. A break above the major resistance invalidates the trade. ❌
🟢 ALTERNATIVE SCALP SIGNAL: LONG (Breakout Play)
· Entry Zone: $0.1515 - $0.1518 (On a breakout above resistance with high volume and RSI staying strong)
· Targets (TP):
· TP1: $0.1530
· TP2: $0.1545
· Stop Loss (SL): BELOW $0.1505
⚠️ RISK DISCLAIMER
This is a HIGH-RISK trade due to overbought conditions. The overall trend is bullish, but a pullback is likely. Use tight stops and only risk what you can afford to lose. This is not financial advice.
#BBUSDT #Scalping #Crypto #TradingSignal #Overbought #Divergence #Reversal #Pullback #BTC #Altcoins #ToTheMoon #DYOR #RiskManagement


