Enter the Quantum Realm of Crypto
In Marvel’s universe, Ant-Man uses Pym Particles to shrink into the Quantum Realm, revealing details invisible to the naked eye. The same principle applies to crypto: on the surface, charts and market caps look smooth and logical. But when we shrink down with Bubblemaps, we see the hidden microstructures—clusters of wallets, insider concentrations, and liquidity imbalances that shape the ecosystem in ways most traders never notice.
Macro Numbers Can Lie
A project may boast a market cap of $250M, with over 60,000 wallet addresses listed as holders. To an everyday trader, those numbers scream “community-driven growth.” But Bubblemaps shows us otherwise: the top 20 wallets control 68% of supply, meaning the “decentralized” appearance is a giant illusion.
Here’s the kicker: if just five of those wallets offload 15% of the supply, the price impact could be catastrophic. In similar cases, tokens have fallen over 70% in a single trading week. Numbers on CMC or DEXTools can mislead—but the micro-level wallet maps never lie.
Liquidity Pools: The Hidden Weak Point
Liquidity is another area where Bubblemaps acts like Ant-Man’s shrinking lens. On the surface, a token may seem safe with $10M locked in liquidity. But zoom in:
1 wallet provides $6.8M (68%) of that liquidity.
Another 3 wallets control $2.1M combined.
The remaining hundreds of LP providers only contribute $1.1M total.
This concentration means that if the main provider pulls funds, the token’s liquidity would collapse by more than half in seconds. Traders without Bubblemaps would never know until it’s too late.
A Case of Wash-Trading Bubbles
NFT collections are notorious for inflated volume, and Bubblemaps makes those manipulations visible. Consider an example where an NFT project reported $50M trading volume in one month. Bubblemaps revealed that 12 wallets were responsible for 85% of trades, passing assets back and forth to simulate activity.
The real organic volume? About $7.5M. That’s nearly an 85% exaggeration. For buyers, that’s like thinking you’re joining a buzzing stadium when in reality you’re walking into a room with a dozen people clapping on loop.
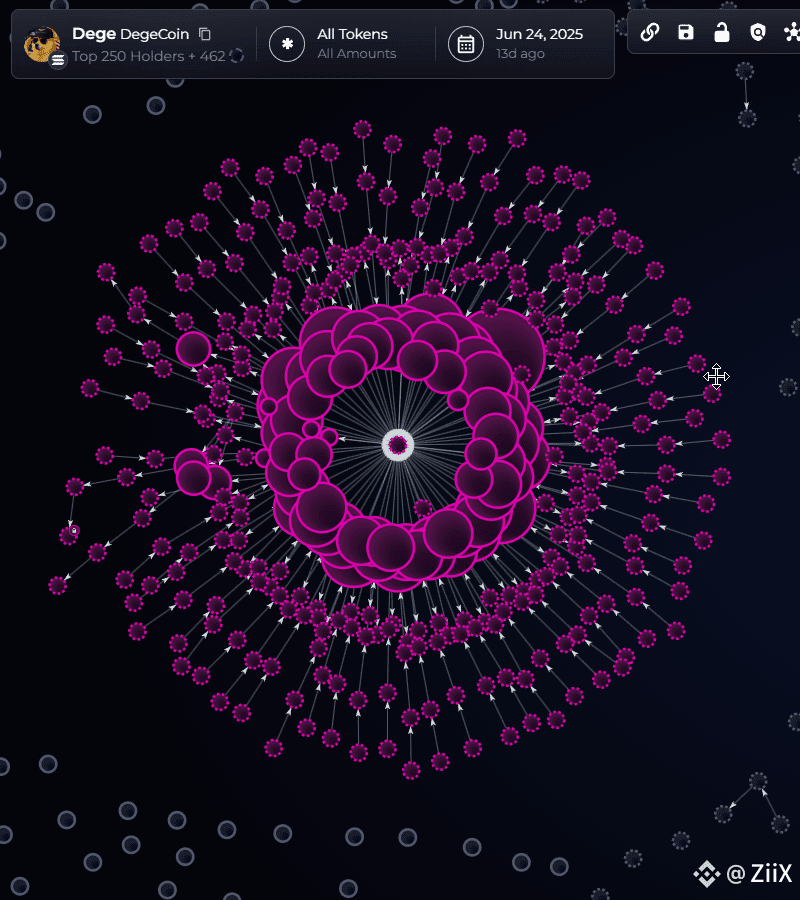
Ant-Man’s “Cluster Vision”
When Ant-Man shrinks, he sees molecules clustering together. Bubblemaps gives us the same perspective, but with tokens and wallets:
A meme coin launched with 30,000 wallets, but Bubblemaps showed 7 wallet clusters tied to one source address controlling 55% of supply.
A gaming token boasted 90,000 holders, but top 10 wallets executed 62% of all trades, essentially dictating the price action.
Without shrinking down, traders would assume decentralization. But with Bubblemaps, the clusters expose centralization hiding in plain sight.
Comparing Healthy vs. Risky Ecosystems
Let’s put two hypothetical projects side by side:
Token X: Market cap $120M, 25,000 holders. Bubblemaps shows top 50 wallets hold 75% of supply, liquidity pool has 80% controlled by two wallets. Risk rating: High.
Token Y: Market cap $85M, 18,000 holders. Bubblemaps shows top 100 wallets control 42%, with liquidity more evenly distributed across hundreds of addresses. Risk rating: Low-to-medium.
From a macro view, both tokens look similar. But shrink down, and only one has the foundations to survive long term.
Why Bubblemaps is the Ant-Man Tool of Crypto
Crypto is full of illusions: fake volume, staged decentralization, and liquidity pools that are more fragile than they appear. Just like Ant-Man reveals quantum-scale truths, Bubblemaps shrinks us down to wallet-level transparency.
For traders, that perspective is the difference between chasing hype and understanding risk. In a market where one cluster of wallets can move tens of millions of dollars overnight, having Bubblemaps isn’t just an advantage—it’s protection.
Conclusion: Small View, Big Impact
In the Marvel films, Ant-Man proves that even the smallest details can decide the outcome of a battle. In crypto, the same is true. By zooming into wallet-level data with @Bubblemaps.io , we uncover truths that save portfolios from manipulation, rug pulls, and orchestrated hype.
Sometimes, survival in crypto isn’t about seeing the big picture—it’s about shrinking down to the micro details that everyone else ignores. #Bubblemaps gives you that Ant-Man vision.$BMT
