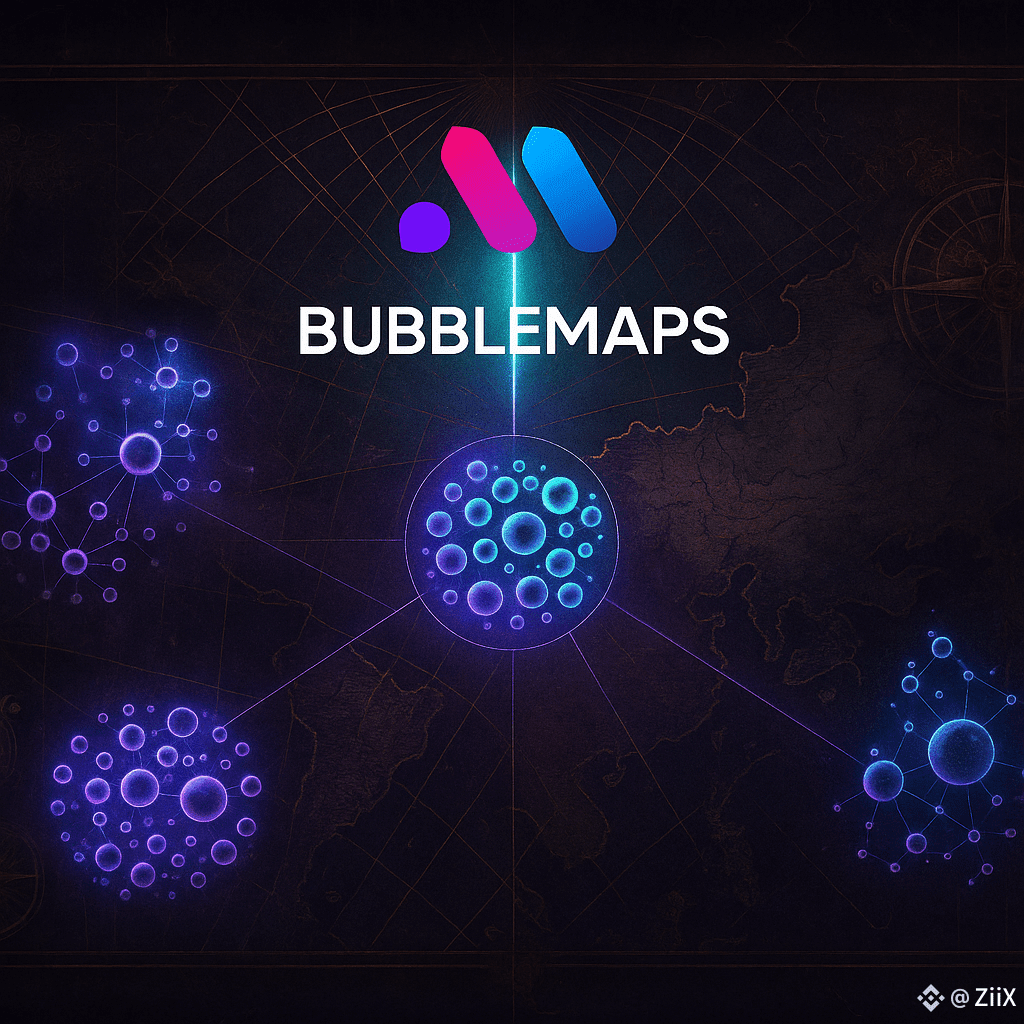
Welcome to the Blockchain Matrix
In The Matrix, Neo stares at streams of green code until he finally sees the truth hidden beneath the simulation. The blockchain isn’t much different. Beneath every meme coin pump, NFT frenzy, or DeFi promise lies a hidden lattice of wallets pulling the strings. To the untrained eye, it’s chaos—millions of transactions happening at once. To Bubblemaps, however, it’s structure.
Bubblemaps is the “red pill” of crypto analytics. It reveals a world where wallet clusters act like agents, liquidity pools shift like trap doors, and token distributions tell stories of power, greed, and manipulation.
Seeing the Code for What It Is
The Ethereum network alone has processed over 2 billion transactions since launch, averaging 1.2 million daily. Solana surpasses that speed with peaks of 65,000+ transactions per second. Looking at these raw numbers is like Neo staring at cascading glyphs—it’s data without meaning.
Mathematically, an honest market should behave like a random distribution. Imagine 10,000 wallets holding a token supply of 1 billion units. If fair, each wallet should average 100,000 units with variance spread naturally. But Bubblemaps often uncovers the opposite: clusters of wallets hoarding disproportionate shares, sometimes 10 wallets controlling over 50% of supply.
This concentration violates natural distribution laws and signals a manipulated simulation.
Clusters as Agents of Control
In The Matrix, agents coordinate seamlessly, appearing everywhere at once. In crypto, wallet clusters often behave the same.
Analysts use Bubblemaps to calculate Internal Cluster Activity Ratio (ICAR):
ICAR=Internal TransfersTotal Transfers×100%ICAR = \frac{\text{Internal Transfers}}{\text{Total Transfers}} \times 100\%ICAR=Total TransfersInternal Transfers×100%
If ICAR < 20% → healthy, open ecosystem.
If ICAR > 70% → strong sign of collusion.
Consider a new token where 80% of transactions happen between just 15 wallets. Bubblemaps turns this into a striking visual: a tight bubble galaxy, orbiting only itself. To the uninitiated, this token may look active. To Bubblemaps, it’s nothing more than an agent program recycling liquidity to fake demand.
Time Travel: Replaying Market Scripts
Every movie has a script, and every token has a timeline. Bubblemaps’ Time Travel feature lets users rewind and replay the evolution of wallets—much like watching scenes unfold in slow motion.
Example:
Day 1: 1,000 wallets, evenly distributed.
Day 7: 50 wallets consolidate 35% of supply.
Day 30: 5 wallets control 60%, executing synchronized trades.
Mathematically, the Gini coefficient (a measure of inequality) jumps from 0.1 to 0.7 in one month. Bubblemaps plots this visually: small bubbles fade, while large ones expand and interlink, exposing the hidden script of manipulation.
Magic Nodes: Finding the Architect
In The Matrix, the Architect designs the system’s rules. In crypto, manipulators design their networks of shadow wallets. Bubblemaps’ Magic Nodes feature acts like Neo confronting the Architect—it reveals hidden ties between seemingly independent addresses.
Suppose Wallet A sends to Wallet B, which sends to Wallet C. Traditional explorers show separate transfers. Bubblemaps highlights their connection, identifying Wallet C as part of Wallet A’s control cluster. Multiply this by hundreds of wallets, and you uncover vast webs orchestrated by a single unseen hand.
This is not guesswork—it’s data. If 80 linked wallets collectively move 40% of supply, the likelihood of coincidence approaches zero. Bubblemaps mathematically proves coordination where others see randomness.
Intel Desk: A Collective Red Pill
Neo wasn’t alone in his journey—he had Morpheus, Trinity, and a crew to help him fight the system. Bubblemaps mirrors that collaboration through its Intel Desk, where over 500,000 traders, analysts, and journalists share suspicious cases, vote, and investigate.
This turns analysis into a collective act of resistance. Wash trading on an NFT? Submit the case. A cluster siphoning liquidity? Expose it. Like rebels mapping the Matrix’s weak points, the Intel Desk transforms isolated observers into a coordinated force.
Mathematical Weapons Against Manipulation
Bubblemaps equips users with formulas that act as weapons against deceit:
Concentration Ratio (CR):
CR=Holdings of Top 10 WalletsTotal Supply×100%CR = \frac{\text{Holdings of Top 10 Wallets}}{\text{Total Supply}} \times 100\%CR=Total SupplyHoldings of Top 10 Wallets×100%
If CR > 50%, decentralization is compromised.Liquidity Extraction Index (LEI):
LEI=Liquidity Removed in 24hTotal Liquidity×100%LEI = \frac{\text{Liquidity Removed in 24h}}{\text{Total Liquidity}} \times 100\%LEI=Total LiquidityLiquidity Removed in 24h×100%
If LEI > 30%, rug pull risk is high.
Network Density (ND):
ND=2EN(N−1)ND = \frac{2E}{N(N-1)}ND=N(N−1)2E
Where E = number of edges (connections), N = wallets. ND > 0.8 often signals wash trading clusters.
These formulas quantify manipulation, ensuring users don’t just see visuals—they measure fraud with precision
Integration: Bubblemaps Everywhere
The Matrix was everywhere—phones, computers, streets. Bubblemaps is embedding itself in a similar way. Integrations with Etherscan, CoinGecko, and DEXScreener put bubble visuals directly into the tools millions already use.

Etherscan alone logs over 1 million daily visits. By surfacing hidden wallet families on these platforms, Bubblemaps injects transparency where manipulation once thrived unchecked.
Choosing the Red Pill
In The Matrix, the red pill was a choice: embrace the truth, or stay in comforting illusion. Bubblemaps is that choice for Web3 participants.
A token with thousands of holders may look decentralized—until Bubblemaps shows that 90% of supply lives inside one glowing cluster. A trending NFT project may boast trading volume—until Bubblemaps reveals 80% of sales are wallets selling to themselves.
To ignore these visuals is to choose the blue pill: comforting numbers masking manipulation. To use Bubblemaps is to accept the red pill: clarity, accountability, and sometimes uncomfortable truths.
Conclusion: Rewriting the System
In the end, Neo didn’t just see the Matrix—he rewrote it. @Bubblemaps.io offers a similar revolution. By visualizing wallet networks, quantifying anomalies, and democratizing forensic tools, it empowers ordinary traders to fight manipulation usually reserved for insiders.
The blockchain will always contain agents of control, but with #Bubblemaps , their disguises falter. Every cluster exposed, every ratio measured, every liquidity drain mapped is one more line of code rewritten in favor of transparency.
The Matrix of market manipulation may be vast, but Bubblemaps proves we don’t have to be blind to its rules. The red pill has been offered—it’s time to see how deep the rabbit hole goes. $BMT

