Many people are attracted to Bubblemaps by the colored block bubbles when they first see it, mistakenly thinking it is just "a prettier on-chain browser." The real value lies in: it compresses the work of manually piecing together token holding structures, address cluster relationships, and funding paths into an interactive graph, and directly embeds the graph into trading/exploration entry points, thereby reducing the issue of "information asymmetry." After the public release of version 2, the official highlighted "Travel in Time (time replay), Reveal Connections (relationship revelation), Manage your Map (custom annotations/layering)" as core entry points; supporting chain coverage includes Ethereum, BNB Chain, Solana, Base, TRON, ApeChain, Sonic, etc., meaning that the token distribution and historical changes of mainstream L1/L2 can be coherently viewed on the same interface.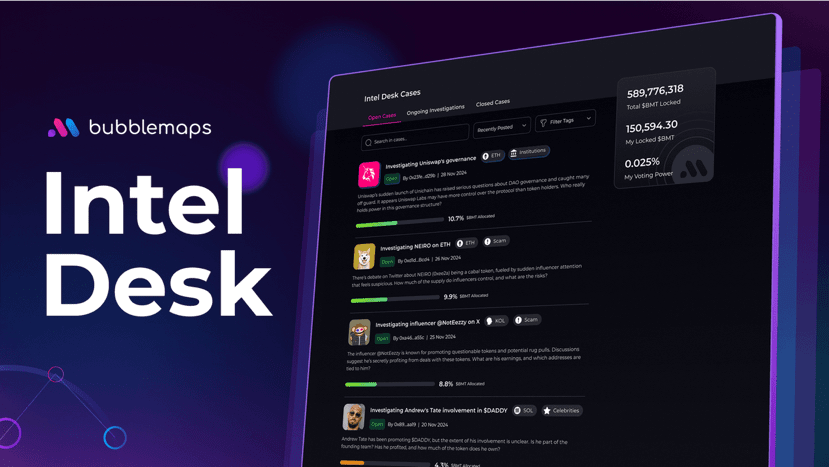
1. The "engineering feel" upgrade of V2 is not in the UI, but in three aspects: speed, history, clustering.
V2 organizes large volumes of historical transactions and balance snapshots into a "timeline" in the backend, while the frontend "time replay" visualizes changes in holdings/address cluster contraction—expansion; clustering algorithms extract "potentially related" address groups and allow for further exploration of secondary paths; visualizing historical dimensions makes phenomena like "whales moving warehouses, project parties aggregating, market making transfers, and cold/hot wallet switching" easier to understand for ordinary users. External reports describe V2 as focusing on real-time visualization of fund flows, wallet clusters, and historical trading patterns, naming "historical inaccessibility" as a pain point in the industry. This design of turning history into a scrollable timeline reduces the barrier to analysis from scripting to dragging sliders.
2. Turning tools into entry points: making "native embedding" with Etherscan, DEXScreener, Pumpfun, Photon, etc.
In the past, the common process for on-chain evidence collection was "find addresses on the block explorer—copy and paste to the tool—then back to the trading platform." Bubblemaps disrupts this chain: the official wiki states that it has achieved embedded integration with DEXScreener, Pumpfun, Photon, Etherscan, etc.; there are also community/exchange content that emphasizes that the bubble chart can be directly invoked on the token page of Etherscan without switching tools. This "one hop to see the chart" model reduces users' hesitation time at critical moments, which is especially important for retail investors.
3. From "visualization" to "intelligence production": Intel Desk hands over topic selection to token holders.
Bubblemaps does not only passively display. The logic of Intel Desk is: use BMT staking/distribution of voting rights to determine the topics and priorities of the next round of on-chain investigations, including tracking abnormal transaction flows, analyzing emerging address clusters, revealing "carpet-pulling" signals, and more. The official blog and several interpretations define Intel Desk as "a community-driven investigative workstation," with BMT as the participation credential and incentive chip; those who contribute high-value evidence and analysis will have an advantage in points and incentive distribution. This effectively writes the process of "public intelligence production" into the protocol, forming a compound case library while providing BMT with real utility scenarios.
4. Products and demographics: From investment research to project parties, from risk control to media.
Users of Bubblemaps are not just "chart enthusiasts." The Pro version and the "Work with us" page name different roles such as project parties, institutions, VCs, and marketing teams: project parties can publicly embed bubble charts to enhance transparency; researchers/media can clarify project risks using the method of "one chart to summarize position and concentration evolution"; VCs and market makers focus on "concentration clusters/dispersal/large fluctuations" as auxiliary evidence for compliance and risk control. The official page also provides data on 500,000 unique visitors per month, explaining the actual significance of "public embedding" for exposure.
5. Why "discovering suspicious clusters" is a focus of popular narratives.
The common characteristics of "on-chain pump and dump" are often a small number of clusters that are highly concentrated, frequent transfers between addresses, and unified selling pressure during key windows. For example, the recent community summary reflected that users feedback that they can "see through whale clusters or concentrated selling at a glance," turning the past task of reviewing dozens of pages of transaction details into a "visual recognition mode." This transition from evidence to visualization is crucial for allowing ordinary users to participate in "fundamental safety checks," especially in high-frequency ecosystems like Solana/BASE, where early identification is akin to wearing a seatbelt for oneself.
6. Cross-chain and single supply: The "penetration" of tool layer and token layer.
On the token layer, BMT adopts a dual-chain issuance of SPL (Solana) + BEP-20 (BNB Chain), and maintains a total supply of 1 billion as a single supply rather than "wrapped tokens" through cross-chain infrastructure; both the official wiki and exchange documents state that "no additional wrapped assets are needed, and cross-chain migration keeps the total supply unchanged." The cross-chain architecture has two positive externalities: one is broader trading coverage (multiple exchanges/multiple chains), and the other is that the participation threshold of Intel Desk is lower (both sides can natively hold/stake). From a tooling perspective, the aforementioned V2's support for the breadth of chains allows for the comparison of "distribution differences of the same asset across multiple chains."
7. Growth rhythm: V2 public testing, expansion to exchanges, activity linkage.
When V2 was opened to the public at the end of May, the media highlighted keywords like "real-time visualization," "time replay," and "wallet clusters and historical patterns"; in the following month, discussions, activities, and task-based content related to BMT significantly increased, with exchanges/wallets/media providing continuous teaching and interpretation. CMC's "latest updates" channel recorded the $150K BMT activity at the end of July and the market node and "Rugproof" clue exposure in mid-August; this kind of "platform content—on-chain evidence—token incentives" linkage explains why the discussion around BMT has remained at a high level since the first half of the year.
8. The reality of the market: Price and market value are merely "thermometers."
As of August 26, 2025 (UTC+8), the real-time price of BMT given by CMC/Coingecko/exchange pages is approximately $0.068–0.069, with 24h trading volume around $18–21 million, CMC ranking ~#773, circulating supply about 410 million, maximum supply 1 billion; different aggregation sources show slight deviations in "circulation," but the structure of "1 billion cap + hundreds of millions in circulation" is consistent across the board. Using sources and time points for anchoring when writing conclusions can avoid discrepancies in metrics.
9. Commercialization and sustainability: It is not about "selling data," but about "selling efficiency."
Bubblemaps' business model is not to wall off data and charge a ticket, but to sell efficiency through Pro features, enterprise services, and embedding licenses: providing projects with a one-click public "transparency module," offering media and researchers chart snapshots and historical replays, and giving platform parties a low-friction embedding framework (iframe/API). External projections estimate annual revenue based on "500,000 MAU, different conversion rates, and ARPU scenarios" and perform FDV verification; although these are measurements from independent institutions, they provide a reference for how "tool-based protocols can self-generate revenue amid market fluctuations."
10. Funding history and team-side evidence: It is not a story of "getting rich overnight."
In September 2023, Bubblemaps raised €3M (approximately $3.2M) in a seed round; multiple venture capitalists and industry insiders participated. For a team that "creates visual infrastructure," the early fundraising scale is not large but stable, combined with the acceleration of productization and integration expansion since 2025, it resembles the growth curve of an "engineering organization" rather than the fireworks of a "marketing project."
11. Use cases and impact: From "viewing charts" to "transforming the cognitive entry of traffic."
When visual prompts of "large holding clusters," "inter-address transfers," and "collective actions during key windows" appear natively on the DEX/browser homepage, the narrative shifts from "KOL says it counts" back to "evidence counts." This "entry as intelligence" paradigm is expected to lower the customer acquisition efficiency of "pump and dump/black box distribution," in turn rewarding projects that are willing to be transparent. This is not a moral appeal, but rather a behavior change through interface design: the more people look at charts before trading, the harder it is for "black box" projects to survive long-term. Feedback from external communities on "PnD identification" and "large cluster warnings" is forming repeatable dissemination material.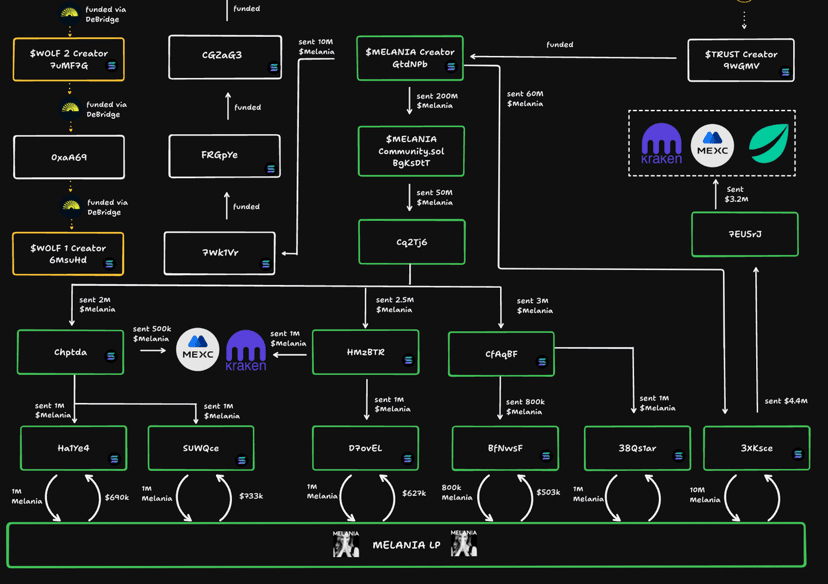
12. Risks and boundaries: Tools may also have the potential for "diminishing marginal utility."
1) Misjudgment and overfitting: The "correlation" of clustering algorithms does not equal "causation"; over-reliance on visualization may overlook protocol layer risks and governance structures.
2) Interface dependency: Changes in strategies of embedding parties (browsers/aggregators) will affect reach; it is necessary to maintain multi-platform redundancy.
3) Intelligence lag: In a high-frequency ecosystem, there is a lag from the occurrence of behavior to the visibility of clustering; users still need to combine trading depth and contract permissions for secondary judgments.
These boundaries do not deny the value of the tool, but only remind readers to treat Bubblemaps as a starting point rather than a complete analysis.
After V2, Bubblemaps is more like an "open intelligence layer": the frontend expands "relationships and history" on demand, while the backend continuously updates "graphs and rules"; the ecological side embeds the "charts" into entry points that every on-chain user will pass through; the token side uses Intel Desk to leave the "what to check" to the community. When on-chain transparency becomes part of a visual interface and trading preferences, the tool shifts from "watching the excitement" to "changing the variables."
@Bubblemaps.io #bubblemaps $BMT
