The significance of transparency tools lies not only in 'viewing the graph', but more in 'drawing verifiable conclusions from the graph'. This requires the platform and community to jointly build a workflow: using the graph to find structural clues, cross-verifying with labels and announcements, restoring evolutionary paths through time playback, and then writing the process into reproducible methods. Bubblemaps' product rhythm and community operation are transforming this from a skill of a few individuals into common knowledge for the majority.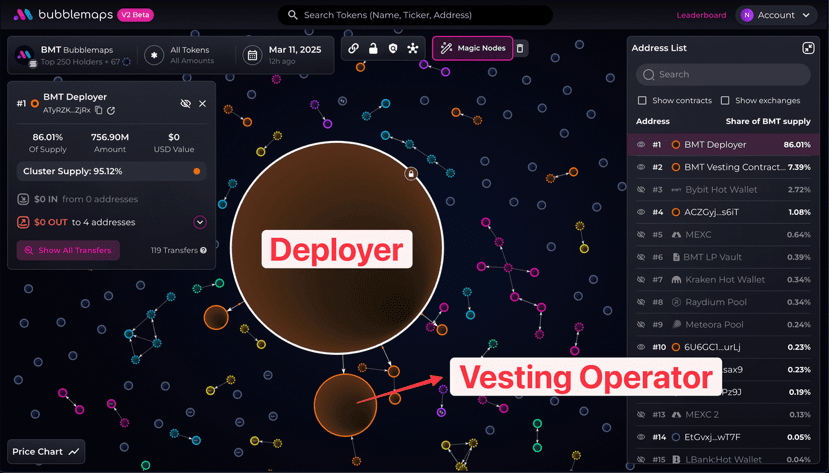
At the tool level, the v2 time playback is a key link. Any unlocking, cross-chain migration, or liquidity adjustment can be replayed on the graph to show the structural differences before and after; Magic Nodes help reduce the probability of 'missing associations', but still need to coordinate with external labels to avoid misinterpreting market-making and arbitrage behavior as common control. The media's overview of v2 emphasizes two values: 'historical restoration' and 'hidden association prompts', indicating that the platform's focus is shifting from 'static display' to 'dynamic tracing'.
From an ecological perspective, multi-chain expansion and activities attracting new users have made the coverage of the graph more comprehensive and the samples richer. Solana's project page provides a clear statement: the platform focuses on the visualization of token distribution and wallet relationships to help identify potential risks; incentives surrounding usage and creation help spread methods to a larger user base. Recent support for TON and activities aimed at creators have directly pushed these capabilities towards larger traffic entrances.
In terms of tokens and governance, BMT's function is positioned as a tool and collaboration enabler: unlocking advanced features, participating in survey topics, and co-building an intelligence repository. Both the popular science articles from Binance Academy and the research articles on the trading platform regard 'community participation' and 'function pass' as the two main lines of the token. Rather than treating tokens as separate investment targets, it is better to see them as aggregators of platform usage rights and collaboration rights; as long as the utility and usage continue to grow, the token's support will also stabilize.
From an industry perspective, Bubblemaps' competitive advantage is not 'exclusive data', but rather 'visualization and workflow standardization'. The graph compresses complex relationships into a readable format; time playback straightens the causal relationships before and after events; the intelligence platform organizes the community verification process. The overlap of these three forms a new 'public due diligence language'. As more exchanges, wallets, and research institutions adopt similar graphics to explain risks to users, transparency will no longer remain a slogan but will transform into a tangible product experience.
In the coming year, the observation indicators can be specified into three items. First, coverage network and label quality: the more chains supported and the more accurate the address tagging, the stronger the explanatory power of the graph; second, the accuracy of historical playback and association identification: a decrease in false positive rates and an expansion of the sample library are hard indicators to judge whether iterations are effective; third, the depth of community collaboration: whether the voting topics are focused, whether the survey conclusions are verifiable, and whether there are public retrospective examples. If these three items continue to improve, Bubblemaps' position in the industry will upgrade from a tool to 'transparency infrastructure', no longer just 'graph viewing software', but 'consensus base map'.
@Bubblemaps.io #Bubblemaps $BMT
