Public chain data can be queried but is often unreadable. Traditional browsers can list the top few hundred holding addresses but find it challenging to present the transfer relationships and connections intuitively. The core approach of Bubblemaps is to visualize the front-row holders using bubble charts: each bubble represents a major address, with the size corresponding to that address's holdings, and lines representing relationships where on-chain transfers have occurred; when several bubbles are densely connected and form clusters, it hints that there may be a common controlling party, internal fund flow, or even abnormal concentration. This method of bringing structural information to the forefront lowers the threshold for non-technical readers to conduct preliminary screenings, and project parties can more quickly identify abnormal inventories, early investor unlocks, and concentration risks. The official wiki provides clear definitions and operational examples for 'bubbles, lines, and clusters', which can serve as a unified entry point.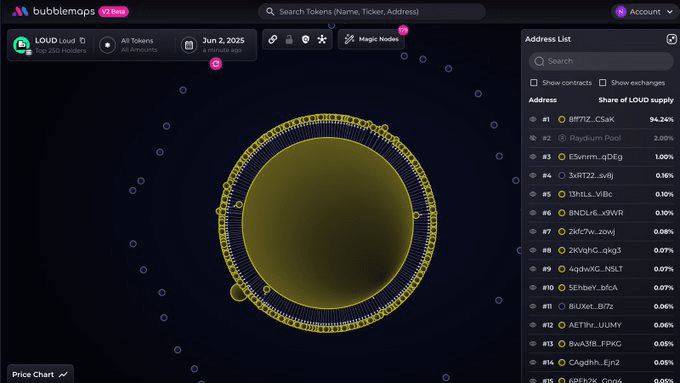
These types of graphs are not inherently magical; their value lies in two points. First, the time dimension. Bubblemaps v2 introduces the 'time travel' capability, allowing for a quick replay of a token's holding distribution and connection structure at different points in time, thereby restoring early distribution, capital concentration, and spillover paths; its accompanying Magic Nodes will mark wallets with suspected concealed connections, helping analysts quickly identify 'seemingly dispersed yet actually connected' control clusters. Media reports in May 2025 detailed the uses and causes of these functions.
Second, the scope of application. In addition to Ethereum and mainstream EVMs, Bubblemaps has continuously expanded its visualization support to more ecosystems over the past year, including hot networks like Solana and TON, facilitating horizontal comparisons of cross-ecosystem capital diffusion and inter-chain migration of hot tokens. The introduction page targeting Solana clearly identifies 'distribution - correlation - risk warning' as the three most important visualization capabilities; support and expansion regarding TON are commonly found in recent progress posts and community articles.
After strengthening the tool, the platform then used incentives to broaden its user base. In March 2025, Bubblemaps issued the platform token BMT, positioned as a passport for tools and governance, used to unlock advanced features and participate in community surveys; Binance Academy's teaching materials broke down the uses of BMT into advanced filtering, historical tracking, and intelligence platform voting, making it easier for new users to understand. Subsequently, in mid-March, mainstream exchanges launched BMT perpetual contracts, further expanding exposure and liquidity.
From the user perspective, the significance of visualization lies in bringing 'doubts' to the forefront: if there are dense connections among the top addresses, if large early transfers concentrate towards a few unmarked wallets, or if clusters rotate internally before and after unlocking windows, intuitive traces will be left on the graph. For compliance and risk control teams, the most common process is to first look at concentration and clusters, then combine on-chain tags, exchange custody, and bridge contract identification for attribution. Bubblemaps makes this path a reusable 'first step'.
Of course, visualization is not a judgment. Lines only represent past transfers and do not necessarily equate to common control; clusters may also form apparent connections due to market making and arbitrage. Therefore, the platform simultaneously emphasizes the balance of 'information density and misjudgment boundaries': presenting the structure aids community cross-verification; articulating hypotheses clearly avoids misinterpretation of graphics as conclusions. Overall, Bubblemaps resembles a 'scene generator', transforming complex data into a publicly discussable base map, which is then explored by the market and researchers. For an industry that emphasizes transparency, such foundational tools are a necessary step to upgrade 'verifiable' to 'understandable'.
After the issuance of BMT, the platform began to link tools with the community: while launching Intel Desk centered around survey voting, it also unlocked deeper filtering, tagging, and historical functions with tokens, supplemented by activities to attract new users and expand the ecosystem. Multiple articles from the platform and community positioned this as a transition from 'visible to usable', aiming to decentralize the capability for quick due diligence to a broader user base during fervent thematic cycles.
@Bubblemaps.io #Bubblemaps $BMT