Bitcoin supporters are still feeling the effects of a giant cascade of liquidations — how much can they lose before the BTC price starts to rise?
$BTC is preparing to fall below old historical highs at $109,300 — where will the BTC price go next?
Crypto traders are poised to set BTC price targets as bulls endure a 13% pullback from all-time highs.
Key Bitcoin trends under threat
The latest Bitcoin drop led to the BTC/USD pair falling below previous all-time highs, first recorded in January 2025.
This psychological level is now under threat, but it is not the only level that worries observers.
Various simple (SMA) and exponential (EMA) moving averages risk going from support to resistance as the price struggles to stop its fall.
“BTC broke the 100-day EMA on the daily chart. This is a bad sign and could pave the way for a deeper correction to $103k.”
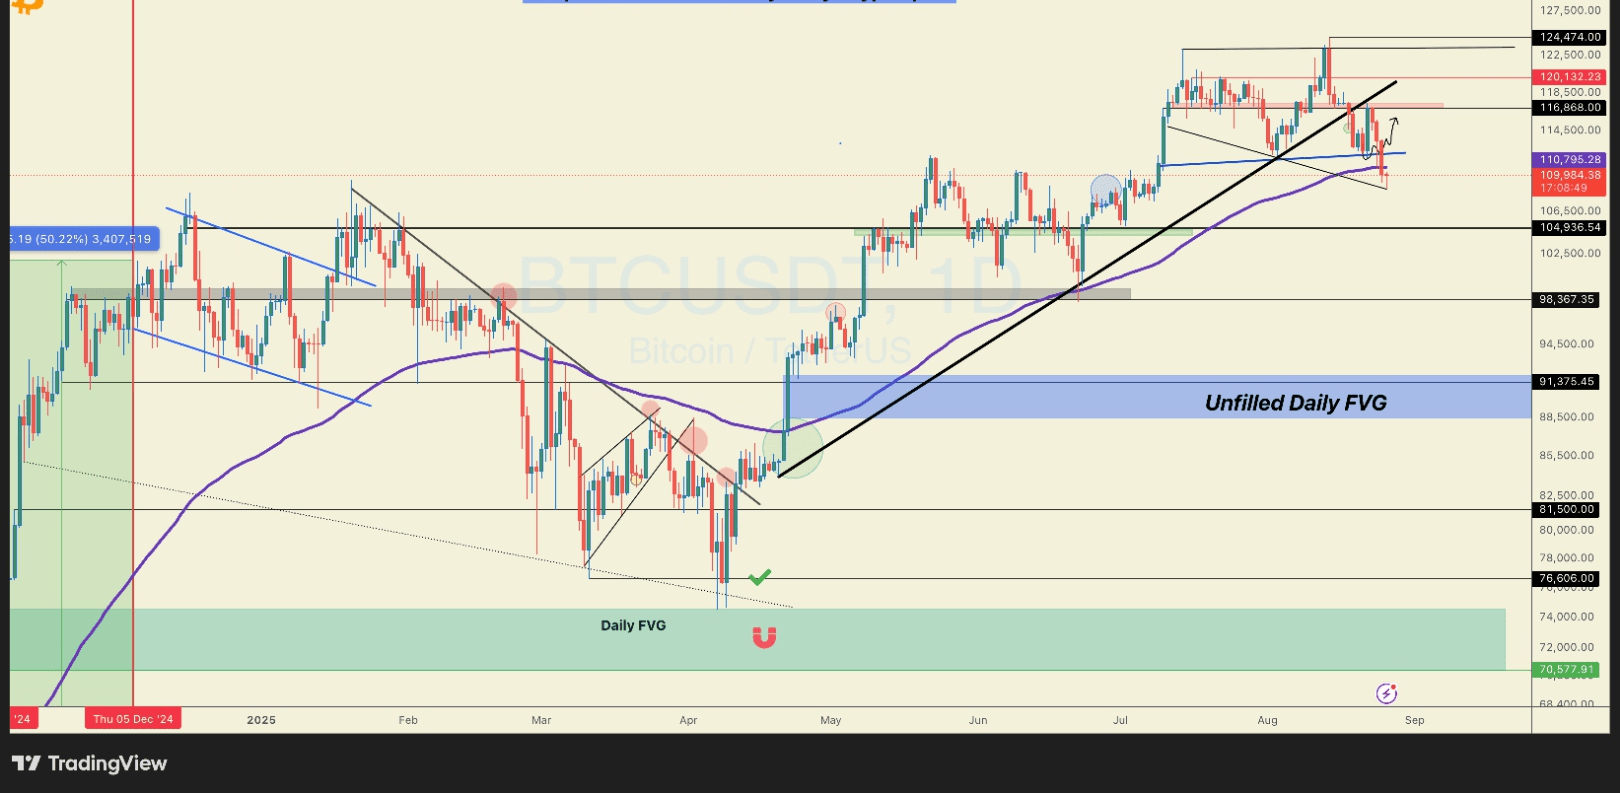
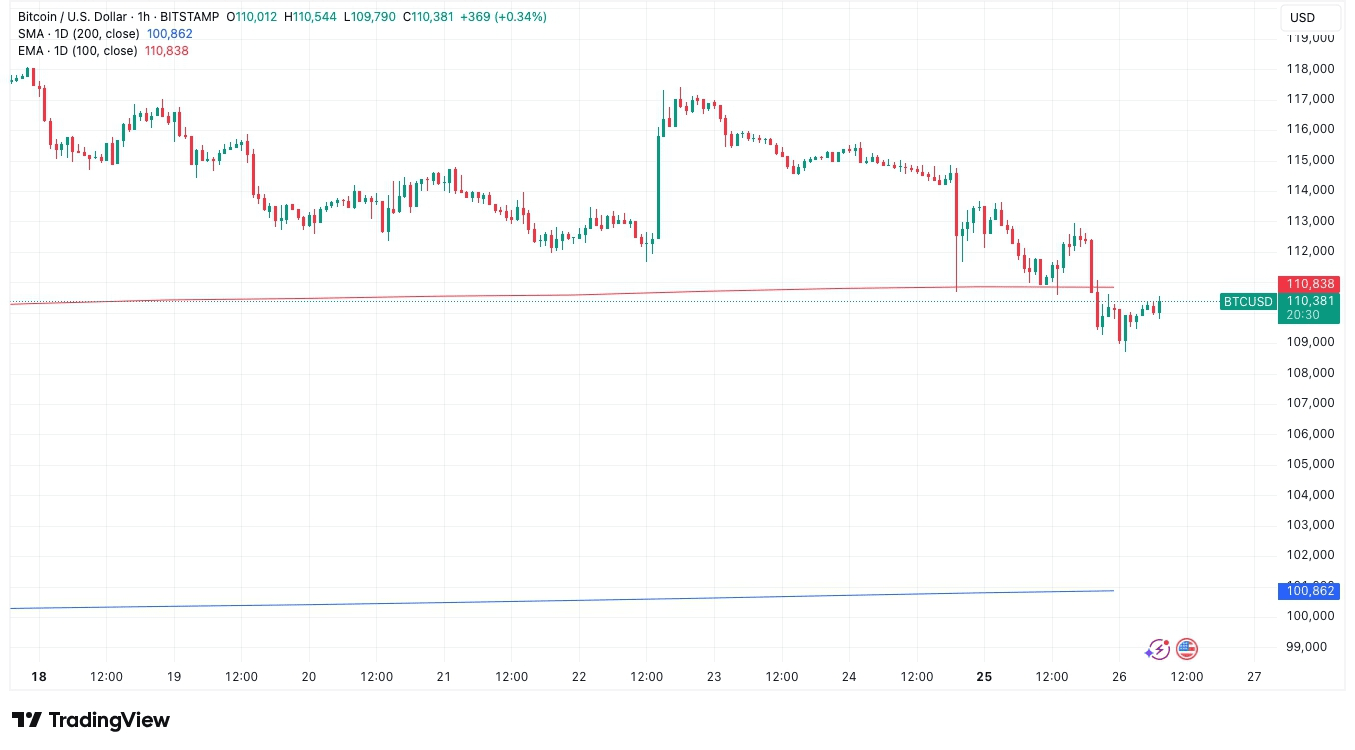
TradingView data shows the 100-day EMA is at $110,820.
Meanwhile, the 200-day simple moving average — a classic bull market support line — is just below $101,000. The last time the BTC/USD pair traded below this trend line was in mid-April.
Speculators are seen as a safety net for the BTC price
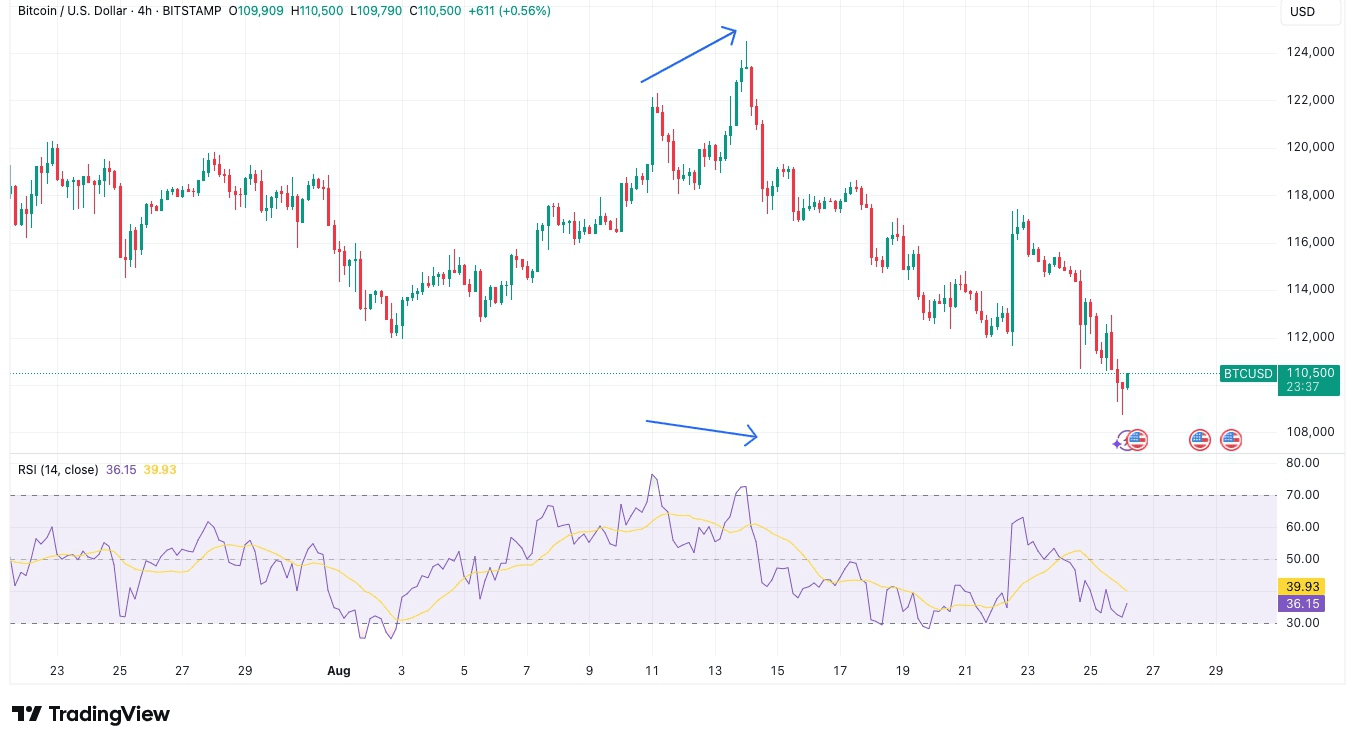
Some market participants have much lower BTC target prices in mind.
These include retesting the $100,000 mark and even falling to a five-digit mark. This happened thanks to a combination of weakening on-chain indicators such as the divergence of trading volume and the Relative Strength Index (RSI).
It is the speculative base of Bitcoin investors that can save the market.
“The nearest strong support zone is the 100–107k range, where the STH realized price and the 200-day simple moving average intersect”
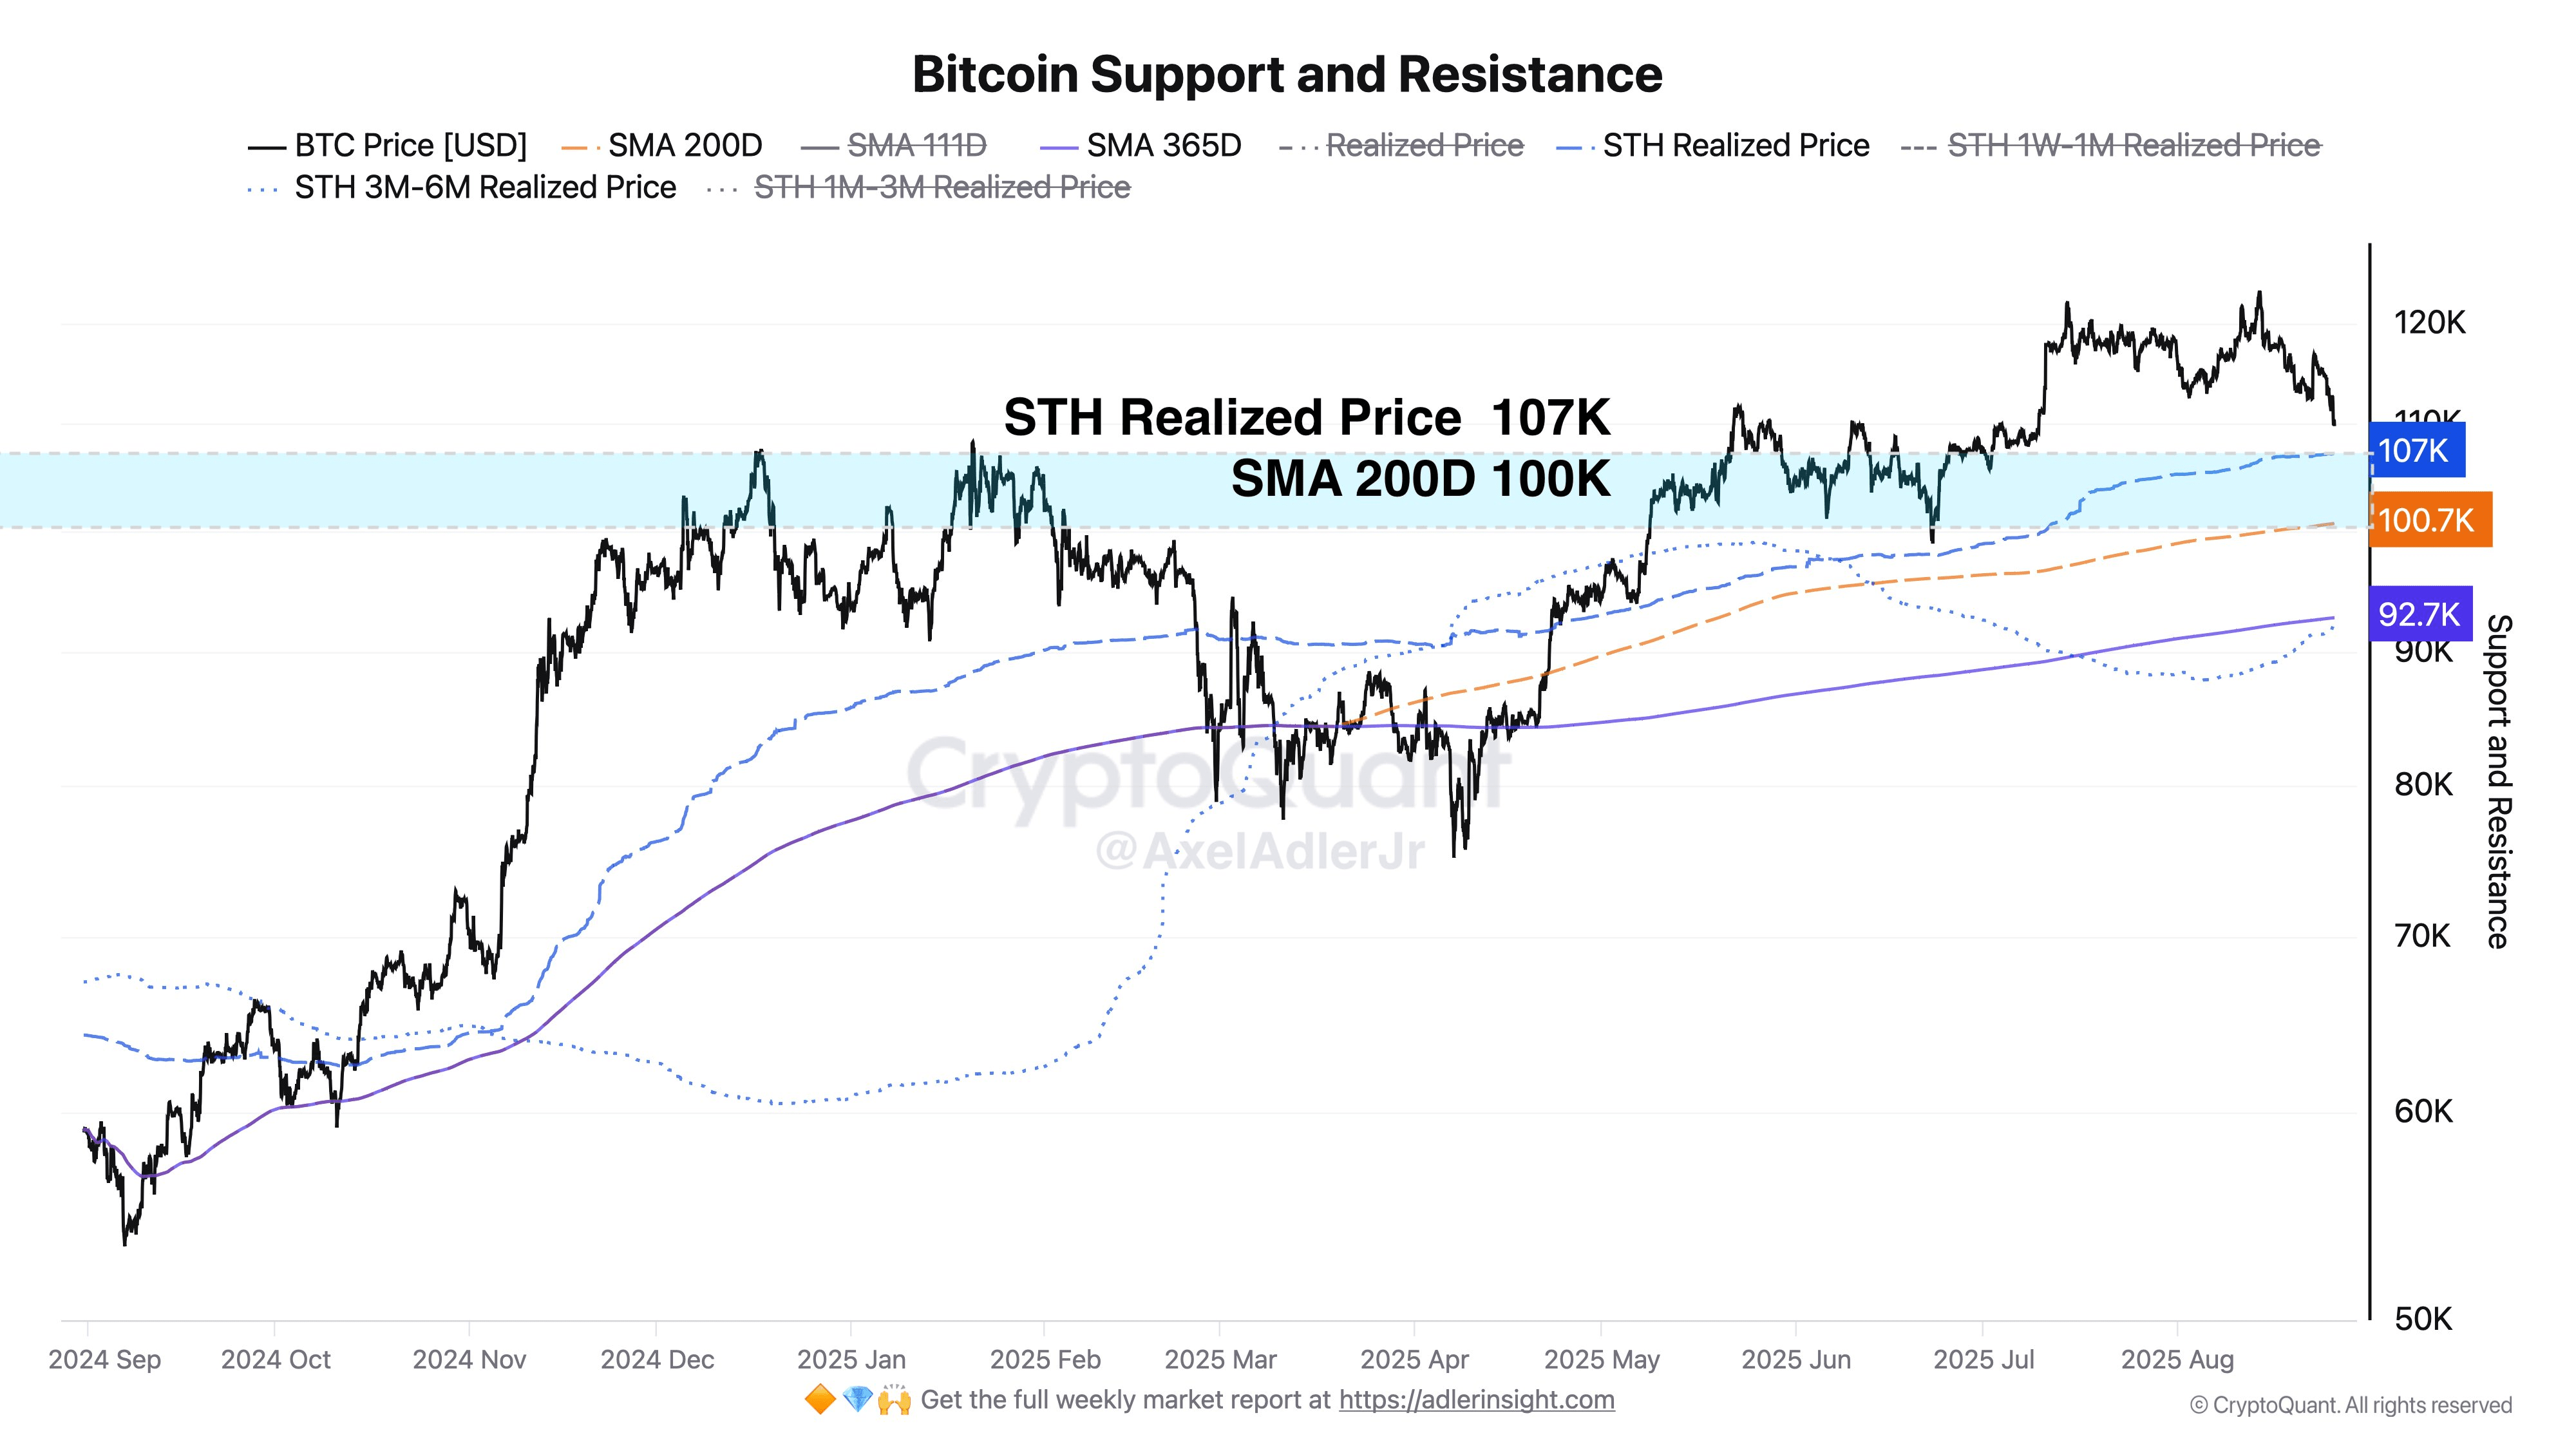
the aggregate value of short-term holders, defined as those holding assets for six months or less. In bull markets, this value often serves as support during pullbacks.
“Below that is additional support around 92–93k, a deeper support level that reflects the underlying cost of short-term investors holding coins for 3 to 6 months. This will be a key second line of defense if the market falls to the 100–107k level”
Short squeeze to $114,000?
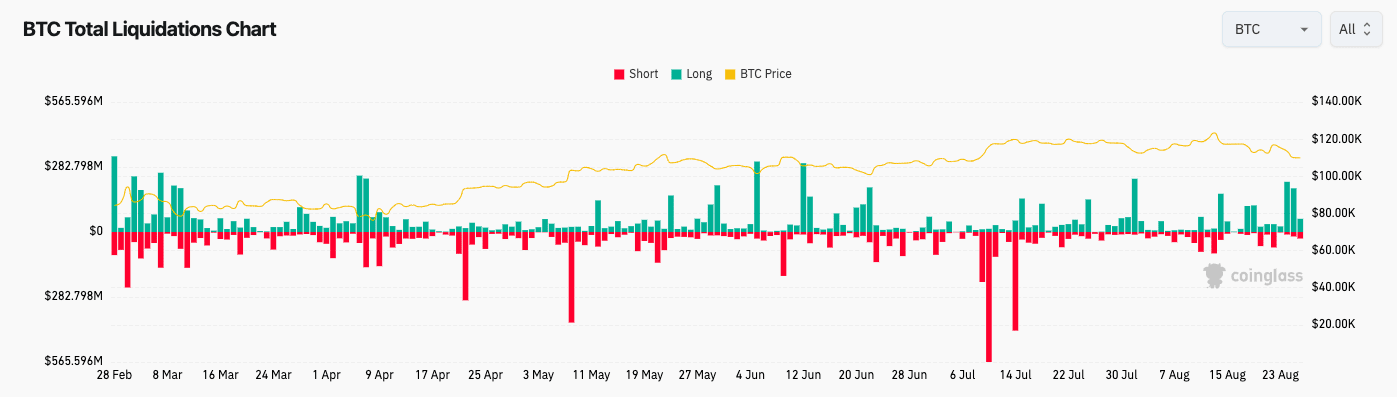
In recent days #bitcoin has triggered several large cascading liquidations as long positions are punished.
According to CoinGlass, total liquidations of BTC long positions have been around $500 million since Sunday.
Judging by exchange order books, most of the downside liquidity has already been taken, creating faint hopes for a market recovery.
“Low liquidity $BTC has been fished out. And now it looks like the next step will be to liquidate short positions”
One way or another, we see that BTC is currently at a crossroads. Of course, it will quickly restore historical prices, it remains to be seen where the “bottom” will be from which growth will begin..........

