The $SUI chart continues to play out within two main Elliott Wave scenarios, the Yellow Count and the Orange Count. While the broader outlook still projects towards higher prices, the market’s inability to sustain momentum raises some questions about short-term direction.
🟡 The Yellow Scenario: One More Push Higher?
In this scenario, the June low was likely a larger degree wave 2, setting the stage for a five-wave move up.
We may currently be in a wave 4 correction, with the potential to start a final wave 5 to the upside.
The structure could unfold as a diagonal pattern: A–B–C, where we still await the C-wave rally.
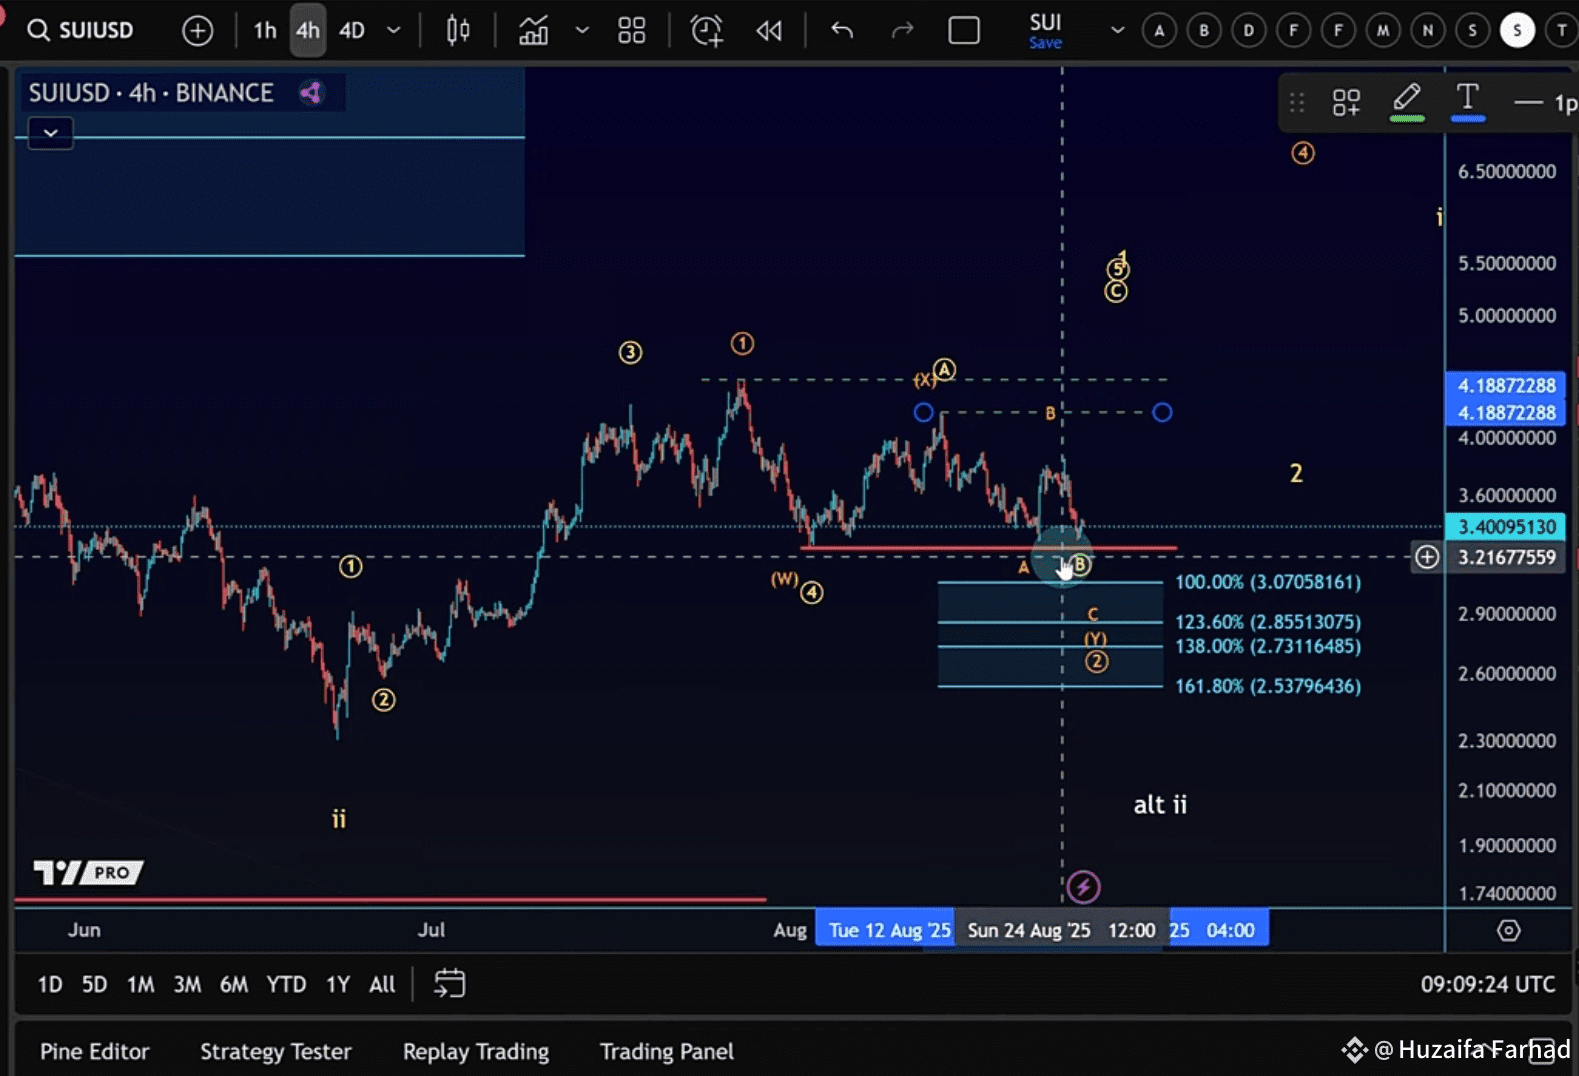
Key levels to watch:
Support: $3.26 (red line – invalidation level)
Confirmation of upside: $3.85 – $3.86.
🟠 The Orange Scenario: Deeper Wave 2
If momentum continues to fade, the Orange scenario gains weight.
This would mean we’re still within an extended wave 2 correction, unfolding as a WXY pattern with a final C-wave decline possible.
The market could revisit lower support, but as long as $2.53 holds, the structure remains intact.

