The market has been hit hard, dropping to new lows.
XRP's recent performance resembles a traditional 'dead cat bounce' rather than a long-term rebound. Momentum has nearly vanished as quickly as it appeared, and after a brief rise above $3.00, the asset has failed to establish significant sustainability. Now, those traders expecting a breakout are clearly realizing that this rebound is merely a fleeting moment, and XRP is at risk of further declines. Its weakness is clearly visible on the daily chart.
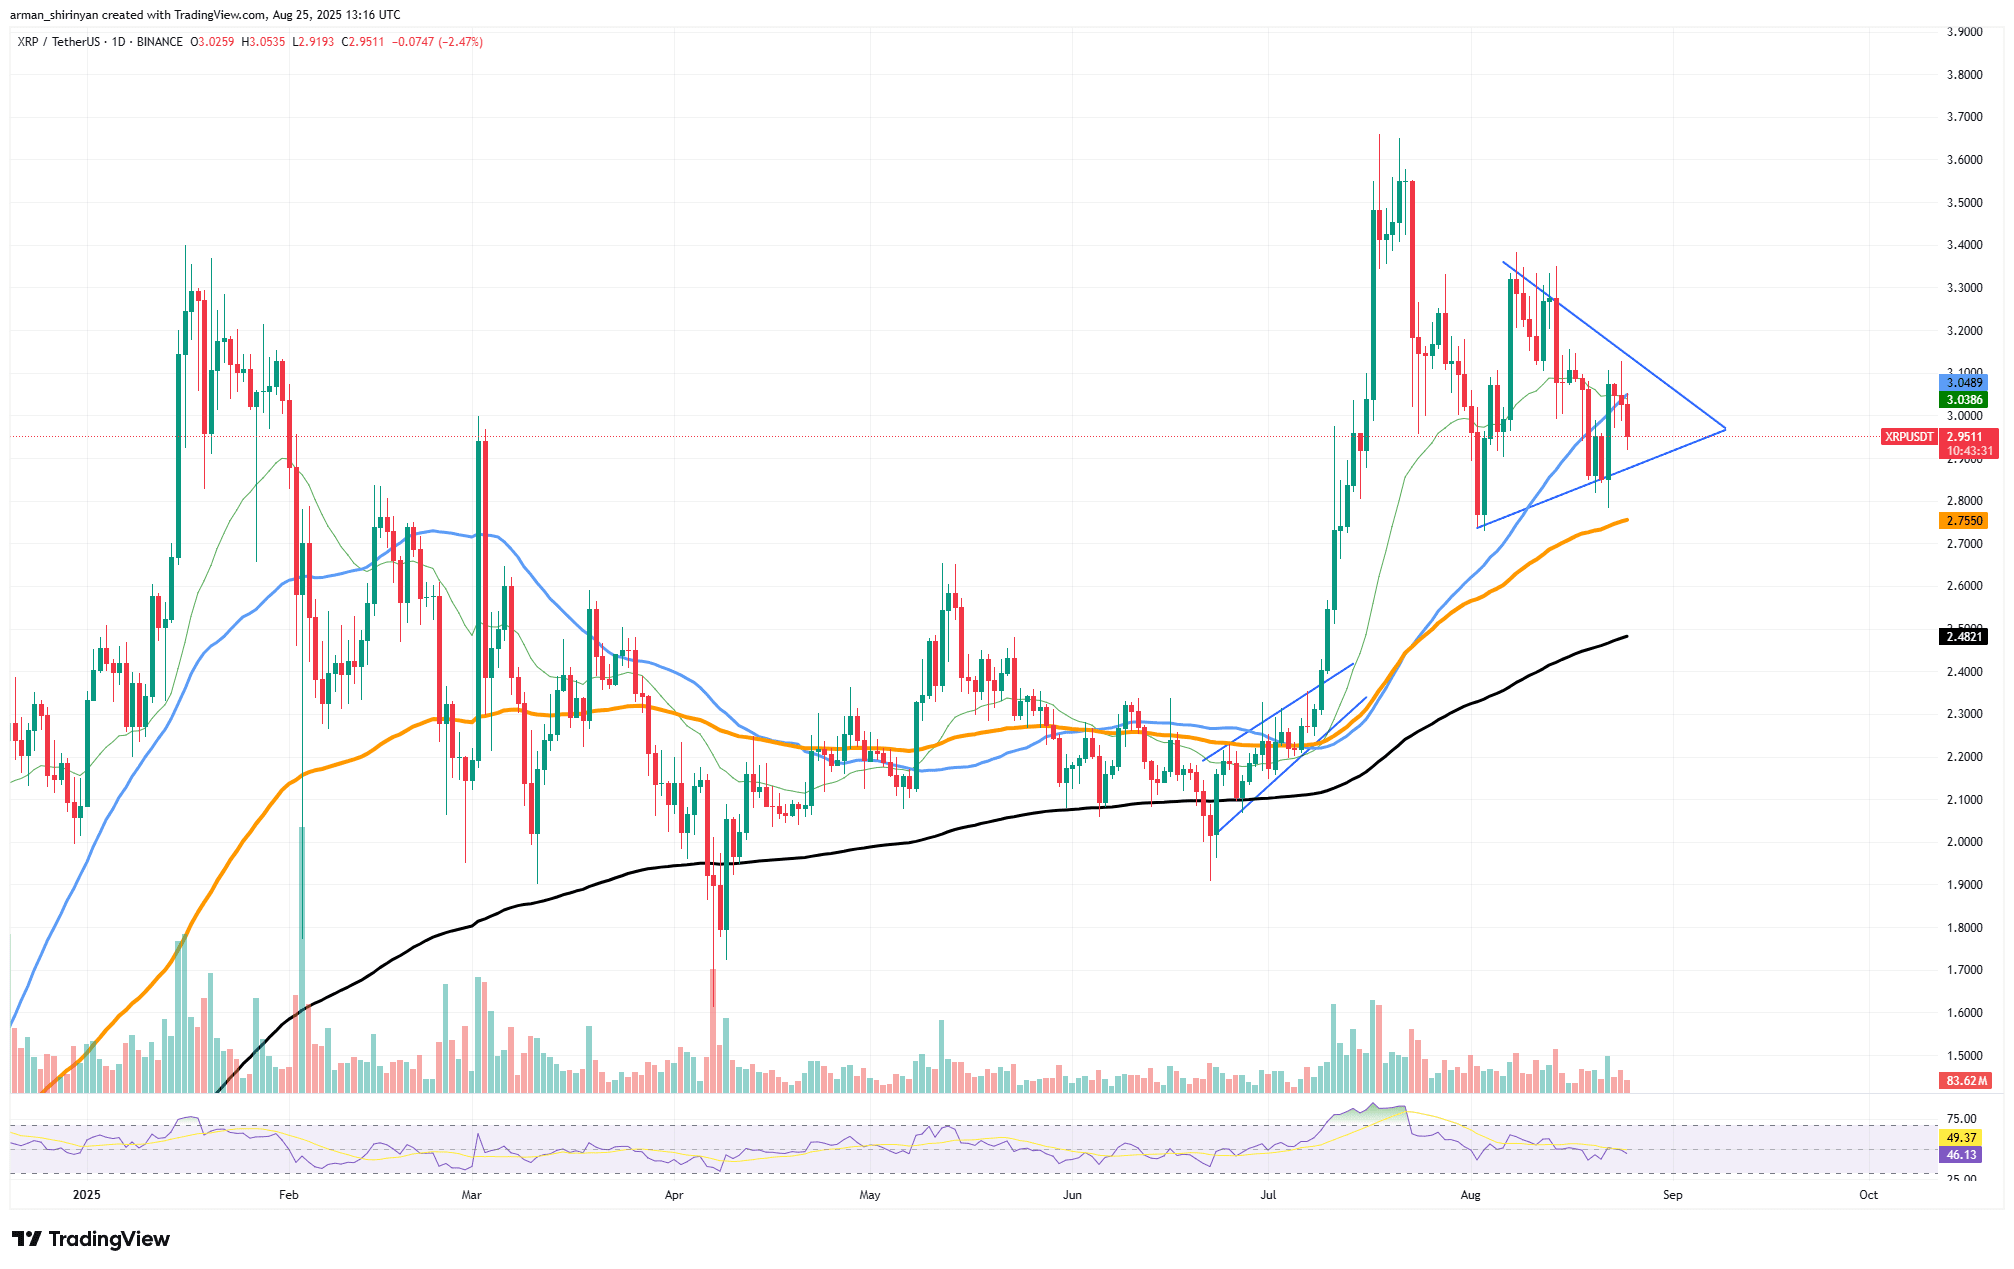
Initially, the 100-day moving average supported XRP's attempt to bounce from the $2.80 support level. However, almost immediately, selling pressure returned to the 50-day moving average, causing price action to stagnate. Due to rejection, XRP is currently trading below significant moving averages, and the 26-day moving average has not provided any substantial support. In the absence of strong catalysts or new buying interest, the market structure strongly leans towards continued bearishness.
The trading volume supports the view that this round of growth has almost no participation, as the rebound coincides with a decline in trading activity. Breakouts rarely sustain without an expansion in volume. This dynamic suggests that the recent rise is not the beginning of a new bull market, but rather a technical pullback.
Momentum indicators like the RSI provide further evidence. The RSI rose slightly during the rebound but quickly fell back, indicating that the upward momentum is weakening. Although the RSI is currently in a downward trend, hovering near neutral territory, this indicator suggests that new selling pressure may emerge soon.
XRP currently has the potential to retest the $2.75 support level, and breaching this support would lead it to further decline towards $2.45. For XRP to regain bullish momentum, it needs to clearly break above $3.10 and maintain sustained buying volume—both of which seem unlikely at this point.
Bearish Bitcoin pattern
A classic 'three black crows' candlestick pattern has formed on the daily chart, making Bitcoin's price action more bearish. Three long bullish candles closed lower than the previous one, indicating a strong bearish reversal, a pattern that usually appears before sustained downward momentum.
This change raises a question: has the momentum behind Bitcoin's recent all-time high slowed? At the macro level, the market environment for Bitcoin remains favorable. Powell's dovish stance and expectations of an interest rate cut in September create an environment that typically supports high-risk assets and liquidity expansion. However, the micro structure of Bitcoin's chart conveys a different message. The 'three black crows' indicate strong selling pressure, while buying volume is insufficient to offset this pressure.
For short-term investors, this disparity between macro optimism and micro weakness may serve as a warning signal. The chart shows that Bitcoin has significantly retraced from the $116,500 area and failed to recover the 50-day moving average. As a weak defense line, the cryptocurrency is instead moving towards the 100-day moving average (around $110,800). The next important support level is around $104,000, and if this level is breached, it will indicate a deeper pullback.
The trading volume further supports bearish expectations, as reduced inflows indicate that new funds have yet to enter the market, and liquidity remains unstable. This means that even though the overall financial environment appears loose, Bitcoin is still highly susceptible to further downward shocks. Currently, Bitcoin traders should closely monitor the support levels of $110,800 and $104,000.
A strong recovery could reverse the bearish pattern, but if these levels cannot be maintained, the pullback period may be prolonged. The 'three black crows' may be the most powerful indication thus far, suggesting that Bitcoin's short-term momentum has clearly shifted into bearish territory, even though the long-term fundamentals remain solid.
Shiba Inu's symmetrical pattern
The trading price of Shiba Inu is close to the lower boundary of the symmetrical triangle pattern that has formed for months, placing the company at another critical point. This key level is crucial, as breaching the ascending support could lead to a price collapse, potentially pushing SHIB down to $0.00001150 or lower. As indicated by the symmetrical triangle, neither bulls nor bears have managed to take control of the market. However, SHIB is currently positioned at the lower boundary, indicating that buyer strength is waning. If the support level is breached, this pattern may turn bearish and exacerbate bearish sentiment.
Insufficient trading volume is one of the most concerning signals. When healthy breakouts occur, whether bullish or bearish, trading activity typically surges. SHIB's trading volume has been declining, indicating a waning interest from investors. Without a significant influx of funds, the likelihood of a bullish breakout above the triangle's resistance is very low.
Momentum is also lacking. The downward trend of the RSI reflects inadequate buying confidence, with the indicator currently hovering around neutral territory. This sign suggests that although the market has not yet entered an oversold area, it may further weaken in the future.
Bulls must firmly defend the lower boundary of the triangle and push the price back into the range of $0.00001300 to $0.00001400 to reverse SHIB's trend. To confirm a reversal and pave the way for higher levels, a clear breakout above the resistance line (currently around $0.00001450) is necessary.
As the symmetrical triangle pattern has significantly narrowed, SHIB's time and space are gradually diminishing. If bulls do not take immediate action, the asset may accelerate its decline in the coming trading days.


