🚨$XRP
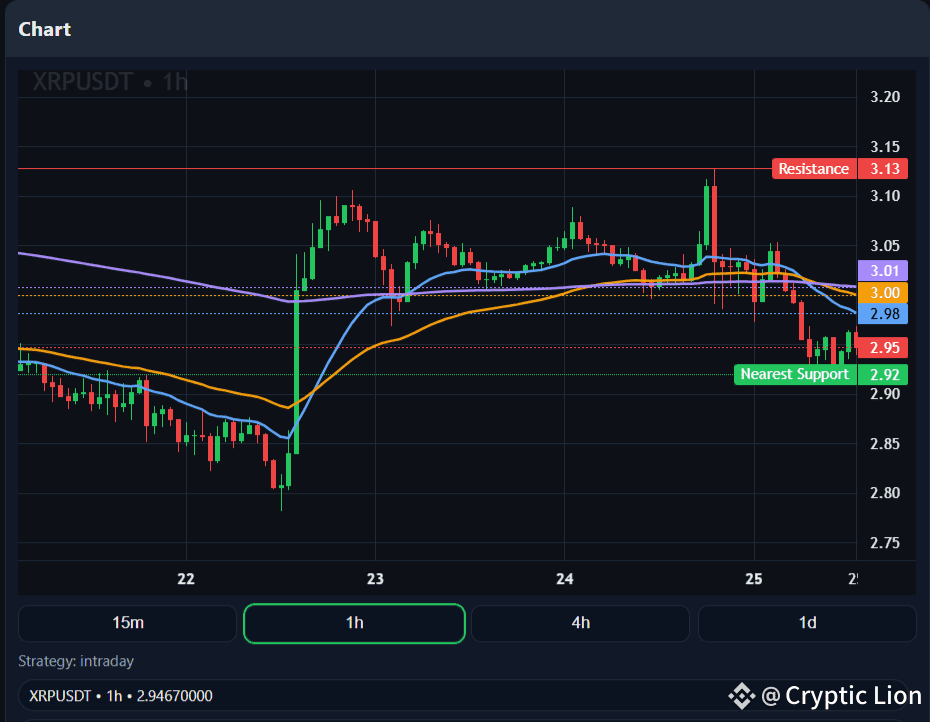
XRP/USDT is trading around $2.94 on the 1-hour chart after a failed attempt to reclaim momentum. Sellers have tightened their grip, pressing the price toward the nearest support at $2.92. Although order book data shows some buy-side activity, momentum remains tilted in favor of the bears.
📊 Trend & Momentum
The EMA stack is bearish (20 < 50 < 200), meaning the short-term structure favors further downside. Price action is below the EMA cluster, with resistance stacked overhead at 3.01, 3.05, and 3.08.
Momentum indicators confirm the weakness. The MACD is bearish (-0.024 vs -0.018), and the Volume Oscillator is negative (-0.28), showing that sellers are dominating the tape. Meanwhile, the RSI is at 39.2, which is weak but not yet oversold, leaving space for further declines before any relief bounce.
🧱 Key Levels
Resistance: $3.01 → $3.05 → $3.08
Major Resistance: $3.13 (red line on the chart)
Nearest Support: $2.92 (green line)
Secondary Support: $2.90 → $2.88 zone
For bulls to regain momentum, they must reclaim 3.01–3.05 with volume. If 2.92 fails, the door opens to test deeper supports around 2.90 or even 2.88.
🧮 Order Flow & Sentiment
Despite bearish momentum, order flow highlights some buy-side strength. The scanner shows an OB buy-imbalance of +27.5% and a buy wall cushioning dips. This could help defend the $2.92 support level temporarily.
However, a lack of breakout signals and the bearish EMA stack suggest that buyers are absorbing pressure rather than reversing the trend. Funding is neutral at +0.01%, meaning this move is mostly driven by spot selling rather than leveraged positions.
🕯️ Candle Patterns
The latest candlestick formations are heavily bearish:
Bearish Engulfing: Strong reversal candle, confirming sellers’ dominance.
Tweezer Top: Shows sellers defending highs, often followed by downside continuation.
Bearish Marubozu: Full-bodied red candle with little to no wick, signaling aggressive downside momentum.
Together, these patterns emphasize bearish continuation unless buyers flip key resistance with volume.
🎯 Possible Scenarios
💀 Bearish Continuation: Failure to hold 2.92 support could drag XRP down to 2.90–2.88, with risk of deeper losses if momentum accelerates.
🚀 Bullish Counter-Play: A strong 1h close back above 3.01–3.05 with a positive Volume Oscillator could spark a push toward 3.08–3.13.
⚖️ Sideways Chop: If $2.92 holds but bulls can’t reclaim $3.01, expect range-bound trading between 2.92–3.05, frustrating both sides.
⚡ Final Verdict
XRP/USDT is currently bearish on the 1h timeframe, with downside momentum confirmed by MACD, VO, and bearish candlestick patterns. Bulls have one last line of defense at $2.92. If that level breaks, sellers could push the pair lower toward $2.90–$2.88. On the other hand, a strong reclaim of $3.01–3.05 with volume would be the first sign of a possible reversal.
🔥 Bottom Line: The market is stacked against the bulls. $2.92 is the key level — hold it and XRP may bounce, lose it and the selloff likely continues.
⚠️ Not financial advice – always DYOR before trading.
👉👉 Trade here $XRP #CryptoRally