
Daily trend analysis: The BTC Bitcoin daily chart has not yet shown new bottom signals or bottom formations. The Bitcoin moving average system has comprehensively weakened, with the daily line crossing below the EMA60, preparing to test the weekly EMA30. Although ETH Ethereum has seen a pullback, the technical outlook remains healthy, currently testing the 4-hour EMA30, and overall it is still in a strong pattern. From the perspective of wave theory, Ethereum is more inclined to follow a three-wave main upward structure rather than the standard five-wave. Currently, the third wave extension conforms to the characteristics of a double main upward wave stimulated by news. Previous review: Long position at 4211, directly rising 600 points, taking it from 4211 to 4800, an impressive performance. EMA30 long position (family channel): On Sunday at the 4725 position, leading family members to go long, reaching the historical high of 4900 again, from 4725 to 4800. Both long positions gained substantial profits, successfully capturing the explosive market after Powell's speech.
BTC support level: Completely not recommended to go long, with extremely low cost-effectiveness. Reference points are 108,500-109,000 (bullish Gartley pattern support range, neckline position, support-resistance switch), 103,800 (weekly EMA30 + 0.786 retracement)$BTC
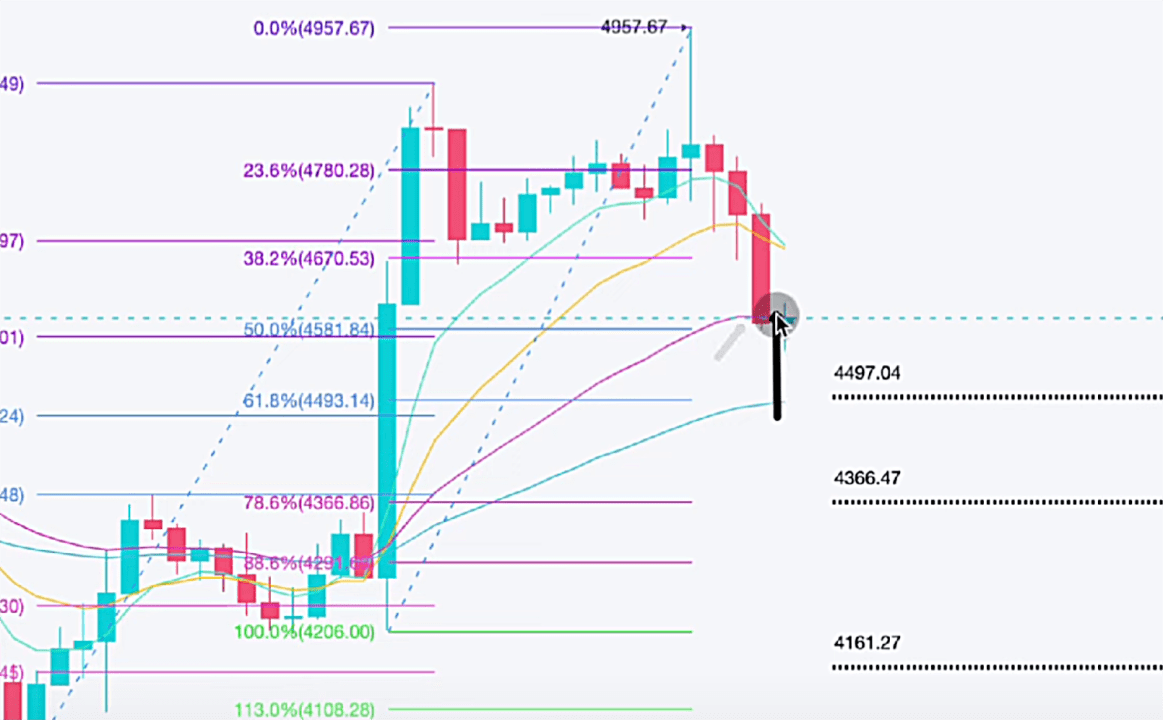
ETH resistance level: 4670 (M top neckline position, resistance level where the 2BM top neckline cannot pass and falls again)
ETH support level: 4490 (0.618 retracement + 4-hour EMA60 overlap + causal logic starting point), 4370 (bullish Gartley pattern + previous wave high point support-resistance switch, systematic support), 4380 (bullish lifeline, if not broken by a large bearish candle, the bulls still have hope)$ETH
For more detailed point analysis, please watch today's market analysis video, which contains detailed explanations. Follow A Ling to study candlesticks, and we will meet at the peak together! Follow for daily updates on the latest point interpretations!
