Current Price Analysis
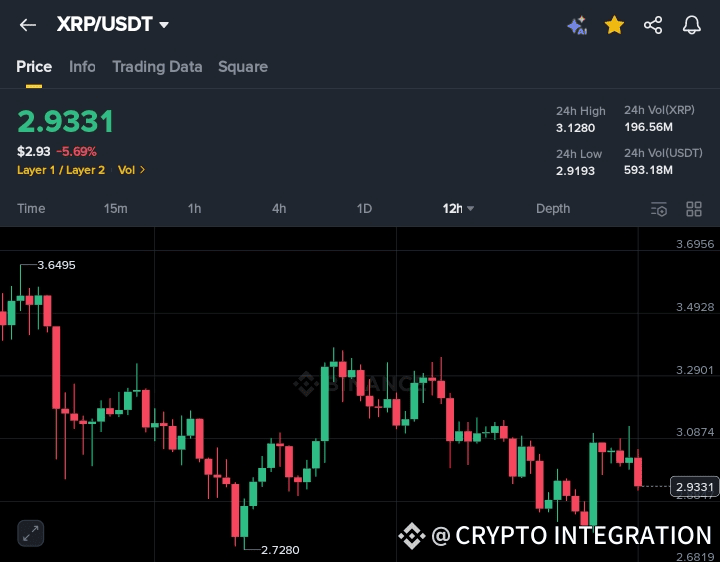
Based on the 12-hour chart, $XRP is currently trading at $2.9331, showing a significant -5.69% decrease. The price has recently broken below a key support level and is now trading below its short-term moving averages. The chart indicates a clear bearish momentum, with a series of lower highs and lower lows being formed. The MACD is also in a strong bearish position, reinforcing the downward trend.
SPOT Check: Best Entry
The price action for Ripple is currently very bearish. The price has decisively broken below a significant support zone, and the technical indicators suggest that the downward momentum is likely to continue. It would be prudent to wait for a clear sign of reversal before considering a buy position.
👉 Suggestion: SELL 🔴
* Reason: The price has broken below a critical support level, and the overall momentum is strongly bearish, indicating a high probability of further price decline.
FUTURES Setup
Binance offers a Futures contract for Ripple ($XRP ). Given the strong bearish signals from the chart, a short position is a logical strategy to capitalize on the current market direction. The price has been rejected from higher levels and is now in a clear downtrend.
👉 Suggestion: SHORT 📉
* Reason: The price has broken down from a consolidation phase, and all major technical indicators are signaling a strong bearish continuation.
This is not financial advice. DYOR (Do Your Own Research).
Wisdom Note: True discipline is in knowing when to step back, not just when to jump in.
Do you agree with this setup? Let’s discuss 💬
#BTCWhalesMoveToETH #FedDovishNow #BTCWhalesMoveToETH #FedDovishNow #Xrp🔥🔥

