Ethereum ($ETH) is showing signs of weakness after repeated attempts to push higher have failed, shifting the trend toward potential downside momentum.
📊 Key Observations from the Chart:
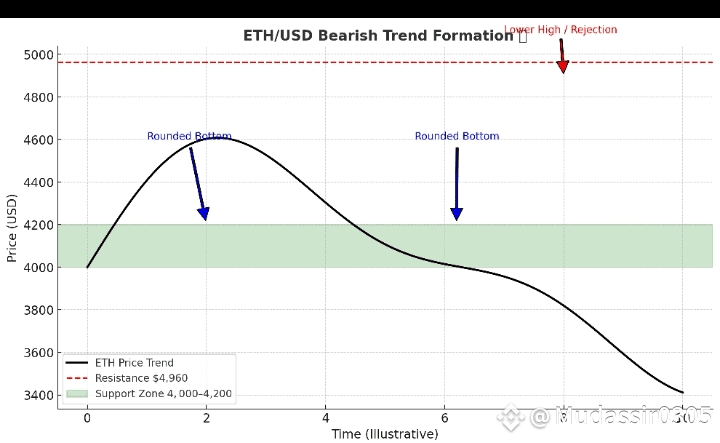
🔵 Rounded Bottom Formations
In recent months, ETH has displayed multiple rounded bottom patterns (blue & green curves). These usually signal strong accumulation phases and bullish continuation. However, the latest attempt failed to sustain upward momentum.
🔴 Resistance & Failure to Break Higher
The price peaked around $4,960 (red arrow), but buyers were unable to drive ETH beyond this crucial resistance. Instead, the rejection has created a lower high — often an early indicator of weakening bullish strength.
🟢 Support Zone Tested Repeatedly
ETH has bounced several times from the $4,000–$4,200 support zone (green arrows). While this level has held strong so far, repeated tests increase the risk of an eventual breakdown.
⚠️ Bearish Outlook:
As long as ETH trades below $4,960 resistance, upside momentum remains capped.
If $4,000 support breaks decisively, we could see accelerated selling pressure, potentially dragging ETH toward $3,600–$3,800 levels.
A lower high + multiple failed breakouts often precede a bearish trend shift.
✅ What Traders Should Watch:
$4,200–$4,000 → Critical support zone. Breakdown = bearish continuation.
$4,960 → Only a breakout above this flips sentiment bullish again.
Market sentiment → Any weakness in Bitcoin could amplify ETH’s downside.
⚡ Bottom Line: ETH is at a make-or-break level. A decisive move below $4,000 could confirm a bearish trend, while holding this zone may keep the broader bullish structure alive — but for now, bears are gaining the upper hand.
Here’s the bearish ETH/USD chart you asked for, showing rounded bottoms, rejection at resistance, and the critical support zone. 📉