Bitcoin (BTC), Ethereum (ETH), and Ripple (XRP) kick off the new trading week in a cautious state, as investors watch key price levels closely. BTC and XRP remain stable at key support zones, while ETH hovers just below its record peak, creating a tense atmosphere and suggesting the market may soon enter a decisive transitional phase.
Bitcoin faces resistance from the downtrend line.
Bitcoin found an important support point at the 100-day exponential moving average (EMA) at $110,865 on Friday, helping the price to surge 3.94%. However, the rapid recovery was quickly halted when BTC hit the previously broken downtrend line, causing the price to reverse and drop 3.42% over the weekend. By Monday afternoon, Bitcoin was fluctuating just below the $112,852 mark.
If the daily candle closes below the 100-day EMA at $110,865, the bearish scenario could be triggered, pulling BTC back to the next support area around $103,701 – coinciding with the 200-day EMA.
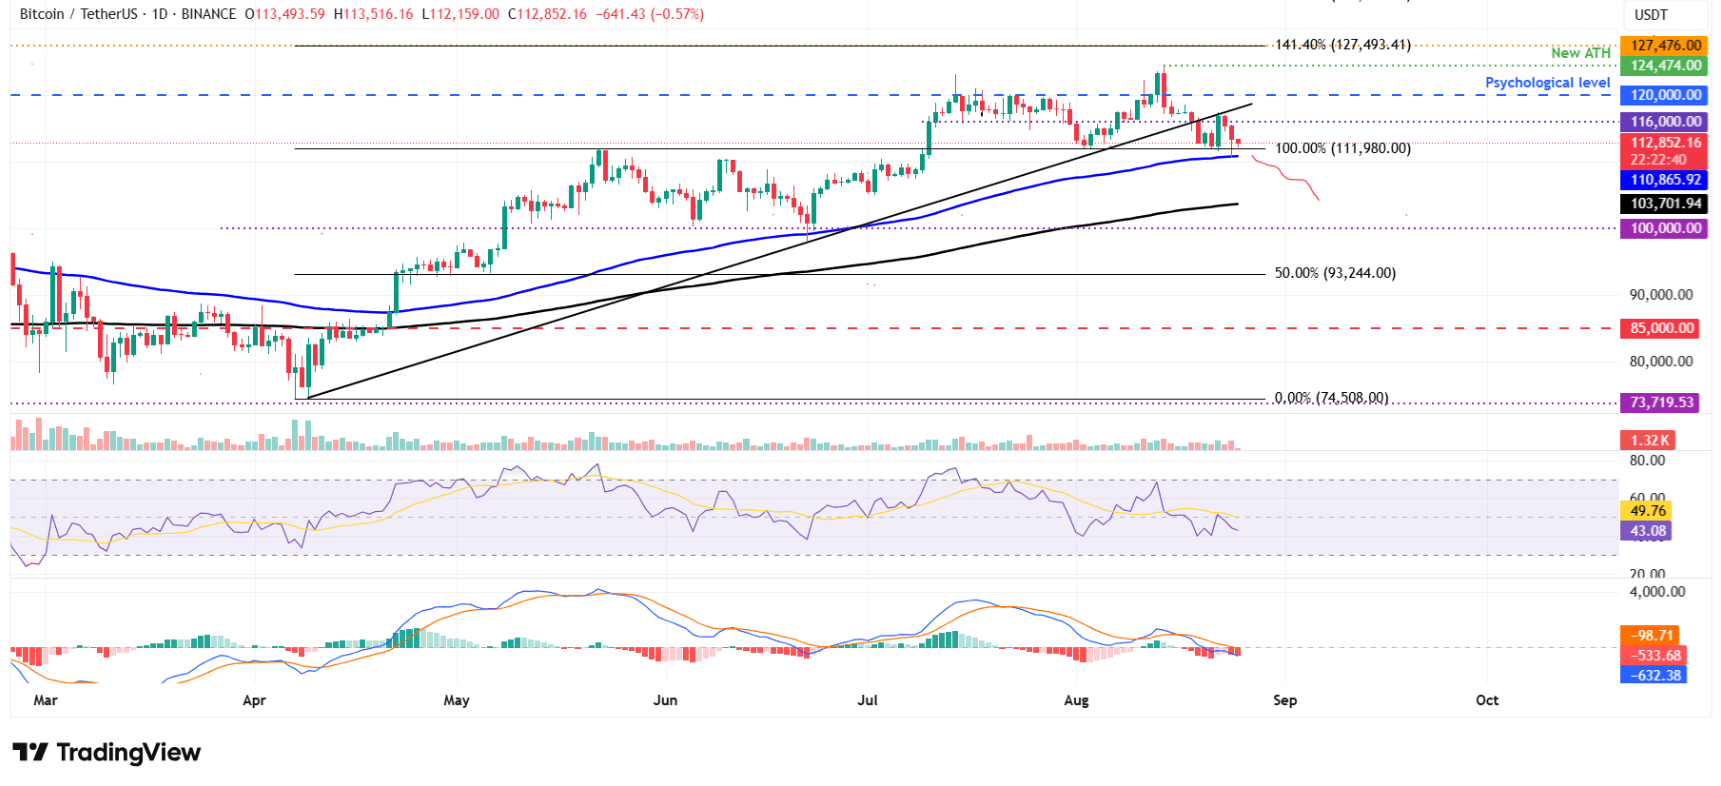
Technical indicators are also reinforcing the negative signal. The RSI index on the daily frame is currently at 43, after being rejected at the neutral level of 50 on Friday, reflecting the weakening buying pressure. Meanwhile, the MACD just showed a bearish crossover last week, increasing selling pressure.
Nevertheless, the optimistic scenario has not been ruled out. If Bitcoin holds above the 100-day EMA at $110,865 and rebounds, this cryptocurrency has the chance to extend its recovery towards the important resistance area of $116,000.
Ethereum is moving sideways after reaching a historic peak of $4,956.
Ethereum found important support around the $4,232 mark on Thursday before impressively surging 14.36% just the next day. The prolonged euphoria helped ETH set a new historic peak at $4,956 on Sunday, before easing slightly and fluctuating around $4,747 on Monday afternoon.
If the upward trend continues, ETH has a strong chance to break the $5,000 mark and set a new record.
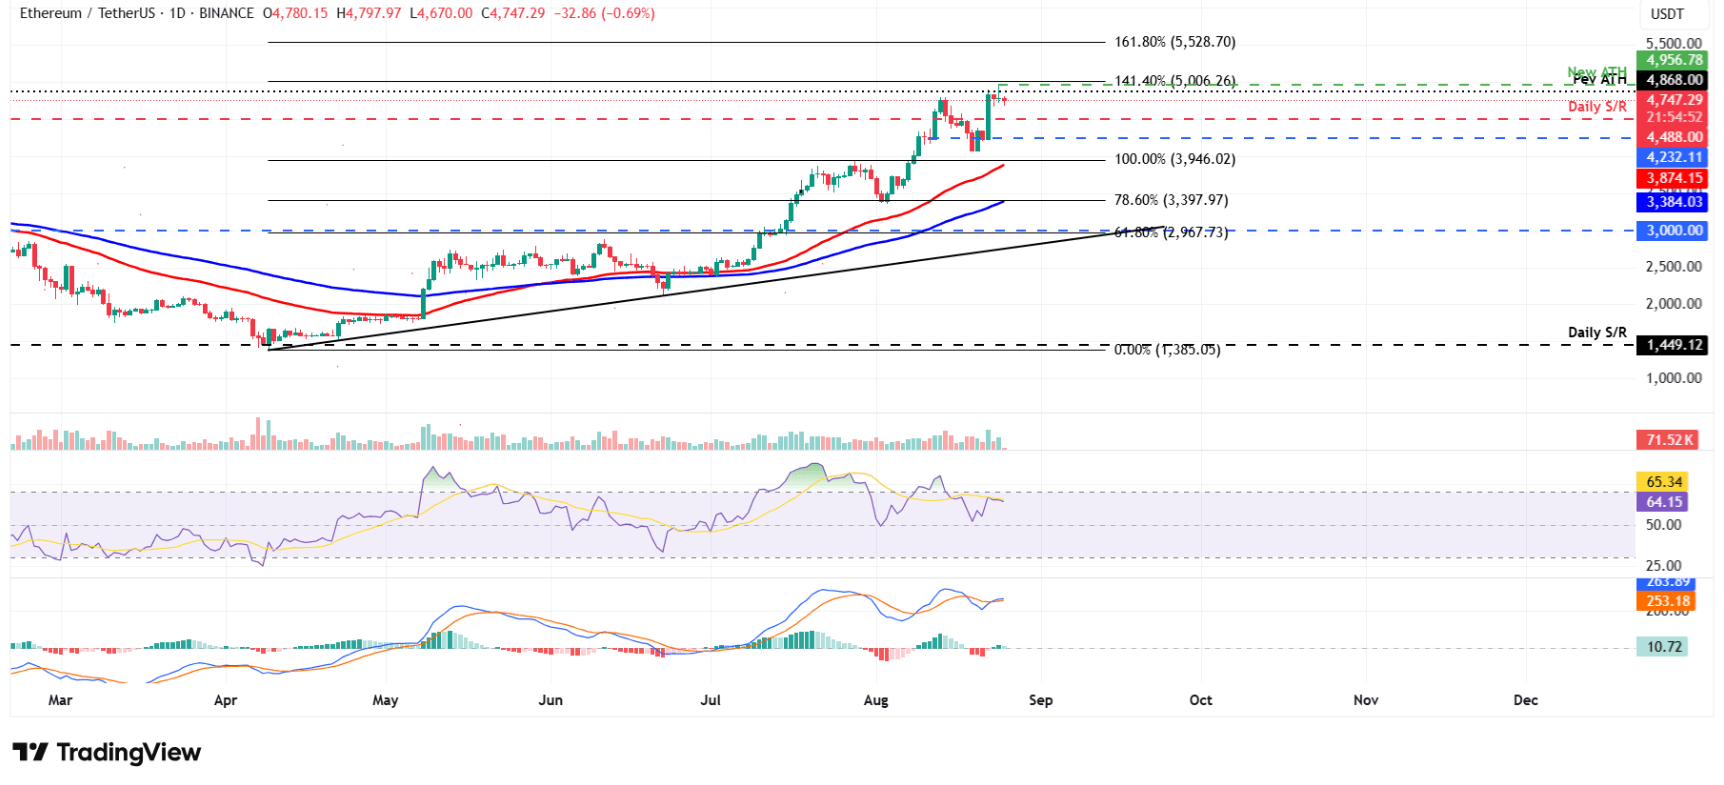
Technical signals are also supporting the optimistic scenario: the daily RSI reached 64, far exceeding the neutral threshold of 50, indicating strong upward momentum. Meanwhile, the MACD recorded a bullish crossover since Saturday, further strengthening confidence in the upward trend.
Conversely, in the event of a correction, ETH may return to test the short-term support area around $4,488 before finding its next direction.
XRP approaches the important support area.
XRP surged 7.80% on Friday after finding support at the 50% Fibonacci retracement level at $2.78, while closing above the important 61.8% Fibonacci retracement level at $2.99. In the following two days, this coin recorded a slight correction but remained solidly above the $2.99 mark. As of Monday, XRP's price continued to fluctuate around this support area.
If the $2.99 mark is preserved and a rebound occurs, the recovery could extend to the next resistance area at $3.40.
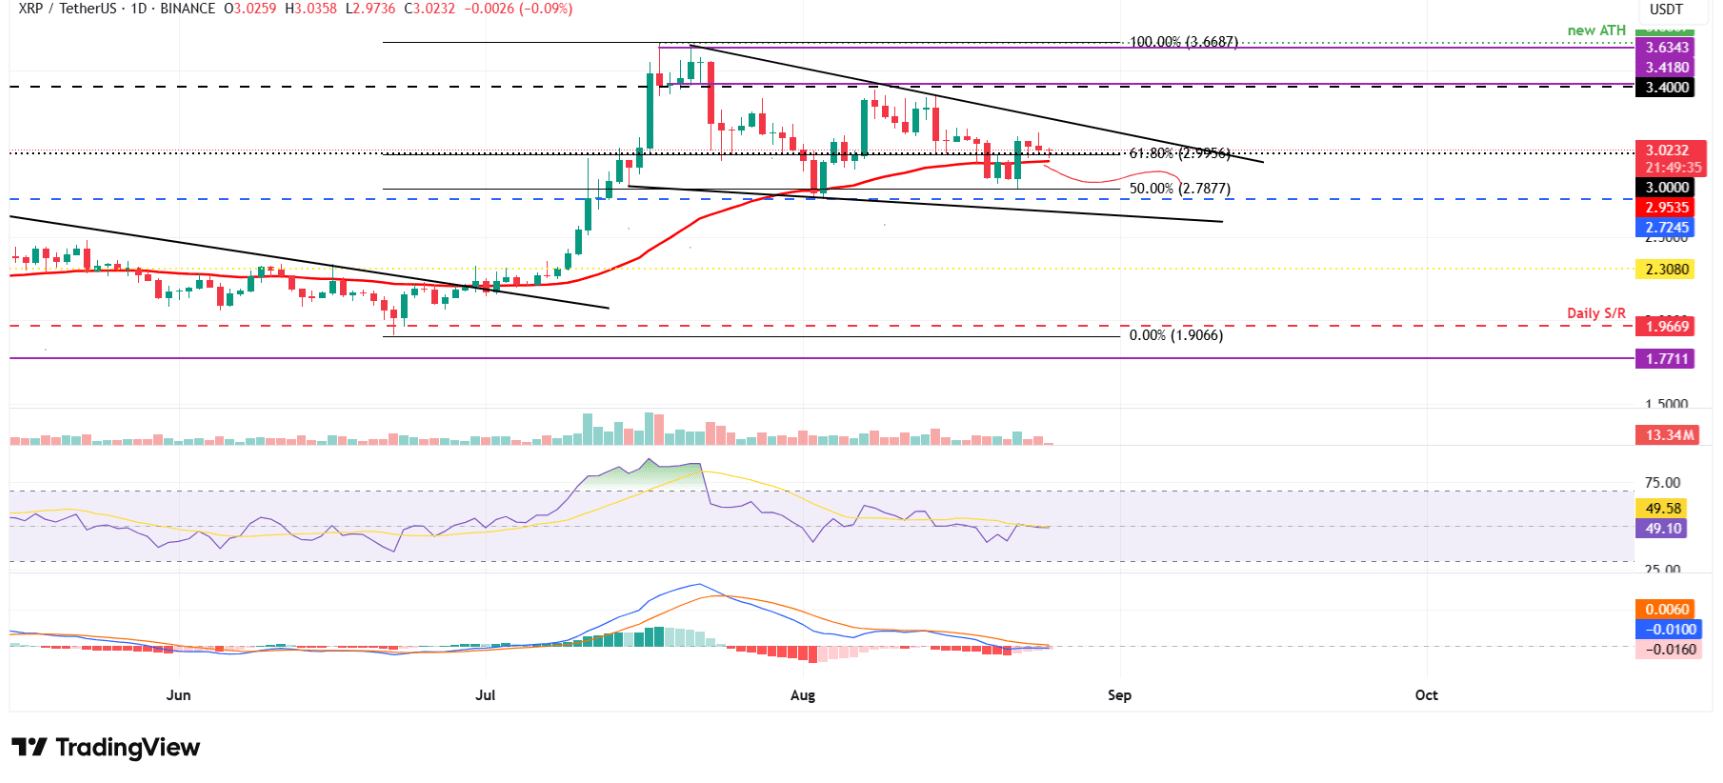
The RSI indicator on the daily frame is currently around the neutral level of 50, reflecting the indecisive sentiment among traders. Meanwhile, the MACD line and the MACD signal line are converging, indicating that the market has not yet formed a clear trend.
On the contrary, closing below $2.99 could trigger a deeper decline, bringing the price back to the support area of $2.78.