
A post-00s cryptocurrency trading prodigy from Shanghai, now with a monthly income in the seven figures and an annual income in the eight figures. Not only is she beautiful and principled, but her skills are also impressive. She represents the new generation of post-00s and has been a friend of Xiao Xun in the cryptocurrency circle for many years. Recently, we met and discussed her glorious history. She spent five years learning and practicing in the cryptocurrency space. She said making money is too simple; many people overthink it. You just need to master the simplest candlesticks to trade, and her win rate is as high as 85%, achieving victory in every battle.
Through my own practice, I have achieved a win rate of up to 80%. I have organized my findings over the past few days and now share them with those who are destined to learn and master them together.
This shows the phases and time cycles of bull and bear markets in cryptocurrency over the years: from four stages of bear market - pre-bull market - bull market - super bull market. The astonishing gains in each time period reveal evident opportunities!
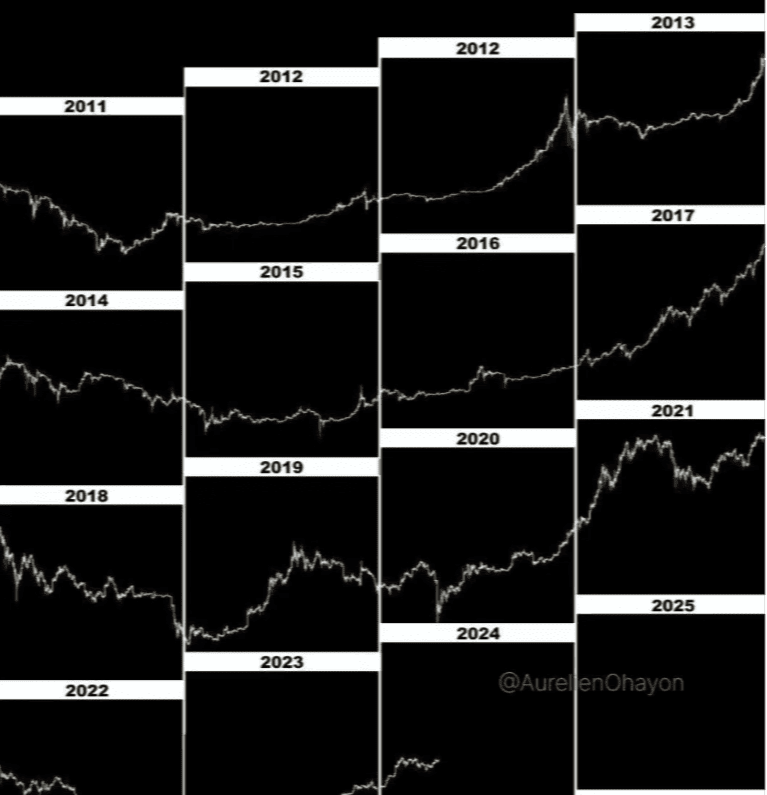
The cyclical nature of Bitcoin is very strong. Place a boat to seek a sword.
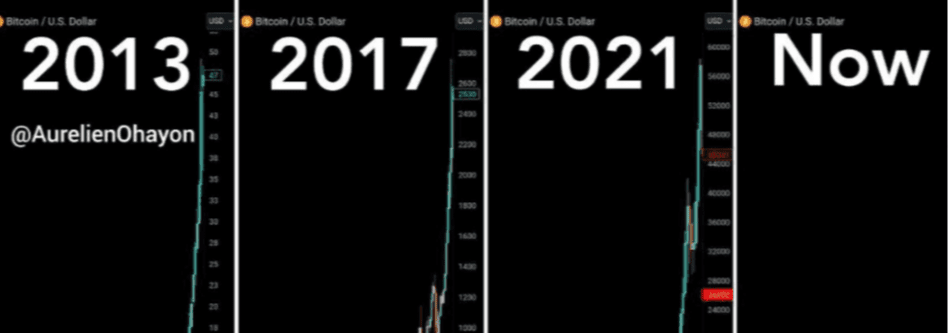
As shown in the figure, the three halving cycles in history (2012, 2016, and 2020) have all led to significant bull market conditions.
Now, with a monthly income in the seven figures and an annual income in the eight figures, the wealth code: mastering candlesticks and trading based on patterns, achieving a win rate of up to 100%.

In the digital currency market, technical analysis is a critical indicator for predicting short-term price trends, commonly referred to as candlestick charts. Regardless of whether you believe or advocate for technical analysis, understanding candlestick charts is essential.
Not understanding candlesticks and randomly trading is a big taboo in the cryptocurrency world! Excluding technical issues related to patterns, indicators, and the battle between bulls and bears, the basic information such as price trends, trading volume, lowest point, and highest point can all be reflected in the candlestick chart.
What is a candlestick?
Candlestick charts are a necessary course for entering all secondary markets. We also refer to candlestick charts as candle charts, which originated during the Tokugawa shogunate in Japan and were invented by Homma Munenobu, initially used to record rice market conditions. Later, due to their meticulous and unique illustration method, they were introduced into the stock and futures markets. Through candlestick charts, we can see the opening price, closing price, highest price, lowest price, and other fluctuations within a certain time period.
What is the use of candlestick charts for me?
Can help you develop better investment strategies and guide you in choosing the best timing for buying and selling. For those who believe in accumulating cryptocurrency, it is also necessary to understand it, as the trading interfaces of major exchanges are dominated by candlestick charts, and not understanding it is actually embarrassing in the cryptocurrency world.
What information can be gleaned from candlestick charts?
Through the candlestick chart, you can see the price trends over specific time periods (30 minutes, 1 hour, 1 day, 1 week...), including opening price, closing price, highest price, and lowest price. You can also see the intense battle history between the bulls and bears.
Highlighting key points.
Composition of candlestick charts.
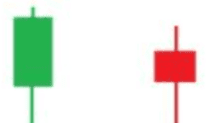
The main components of a candlestick chart are two: bullish lines and bearish lines.
Each candlestick represents the four prices of the day: highest price, lowest price, opening price, and closing price. The part between the opening price and closing price is drawn as a 'rectangular body', and the highest and lowest prices are connected, forming the candlestick.
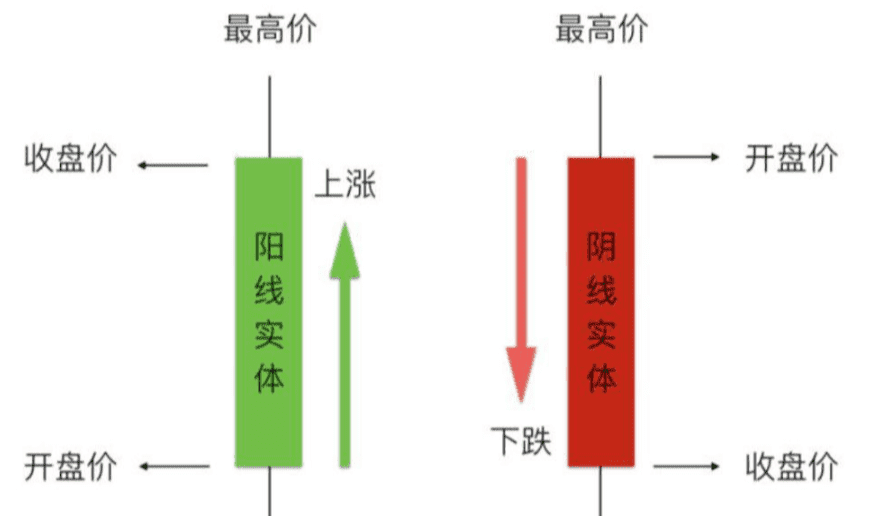
When the closing price is greater than the opening price, the body is green, indicating a price increase, which we call a bullish line.
When the closing price is lower than the opening price, the body is red, indicating a price decrease, which we call a bearish line.
Most trading platforms and analysis software in the cryptocurrency market use green to represent bullish lines and red to represent bearish lines. Generally speaking, bullish lines represent the bulls (buying), while bearish lines represent the bears (selling). The stronger side appears in the corresponding candlestick in the candlestick chart.
Taking the daily chart as an example: If the buying power is greater than the selling power today, then today’s candlestick in the daily chart is a bullish line (green bar). Conversely, if a bearish line (red bar) appears, it indicates that the selling power is stronger.
Note: In the Chinese stock market, bullish lines are red and bearish lines are green; in some graphics, bullish lines may also be represented as solid bars, while bearish lines are hollow bars.
What is a shadow line?
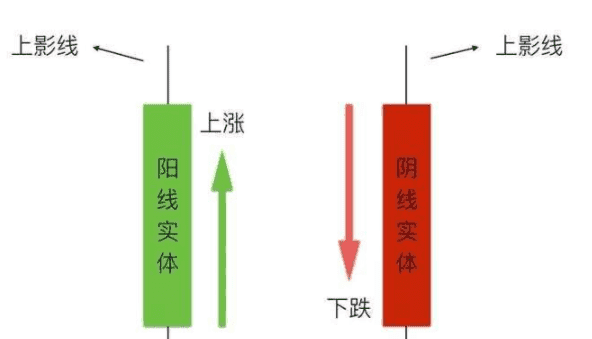
A shadow line is the thin line at the top and bottom of the candlestick, indicating the difference between the highest and lowest prices of the day relative to the closing price. The longer the shadow, the greater the resistance. A longer upper shadow indicates greater resistance to upward movement, while a longer lower shadow indicates greater resistance to downward movement. Regardless of bullish or bearish lines, the straight line protruding upward from the body is generally referred to as an upper shadow, while the straight line protruding downward from the body is referred to as a lower shadow.
What is the battle between bulls and bears?
Bulls and bears are two factions; the bull side represents the green faction, while the bear side represents the red faction. The two sides have differing views: the bulls believe prices will rise, while the bears believe they will fall, resulting in frequent battles. The green faction consists of those optimistic about price increases who will buy and drive prices up, while the red faction consists of those pessimistic about price decreases who will sell and drive prices down.
In every time frame, battles will occur; if the bearish red army wins, prices will fall and the candlestick chart will show red. If the bullish side gains a significant advantage, it indicates strong power, and the body shown in the candlestick chart will be larger. If the green side's resistance is weak, it indicates that the resistance posed to the red side is too small, resulting in very short shadows on the candlestick chart.
Small bullish star, small bearish star.

A. Small bullish star:
Represents that the price fluctuated very little throughout the day, with the opening price and closing price being extremely close, and the closing price slightly higher than the opening price.
The appearance of a small bullish star indicates that the market is in a chaotic and unclear stage, making it impossible to predict future price movements. At this time, comprehensive judgment should be made based on the shape of the previous candlestick combinations and the current price area.
B. Small bearish star:
The chart of a small bearish star is similar to that of a small bullish star, except that the closing price is slightly lower than the opening price. It indicates a weak market with an unclear direction of development.
Small bullish star, small bearish star.

C. Small bullish line:
The fluctuation range of the small bullish star expands, the bulls have a slight advantage, but the upward momentum is weak, indicating a confusing market situation.
D. Small bearish line:
Indicates that the bears are in a suppressive stance, but the pressure is not strong.
No-shadow bullish line, no-shadow bearish line.

E. No-shadow bullish line:
① If a no-shadow bullish line appears in a low price area, it manifests as the price probing the bottom before rising wave by wave, with trading volume simultaneously increasing, indicating the beginning of an upward trend. It shows that the price has exhibited shrinking trading volume during the probing process, and as the price gradually rises, the trading volume expands evenly, ultimately closing with a bullish line, suggesting bullish prospects ahead. If it appears during an upward trend, it indicates a continued positive outlook.
② If a hanging bullish line appears in a high price area, it may indicate that the main force is lifting the price for selling, which requires caution.
F. No-shadow bearish line:
If this line type appears in a low price area, it indicates that the intervention of bottom fishers shows signs of price rebound, but the force is not strong.
Lower shadow bullish line, lower shadow bearish line.
G. Lower shadow bullish line:
Its appearance indicates that in the battle between bulls and bears, the bulls are attacking steadily and powerfully, causing the price to fall and then rise, suggesting further upward potential.
H. Lower shadow bearish line:
When appearing in a low price area, it indicates that there is strong support below, and the price has a possibility of rebounding.
Upper shadow bullish line, upper shadow bearish line.

Ⅰ. Upper shadow bullish line:
① It shows that there is heavy selling pressure when the bulls attack. This pattern is often seen during the main force's testing actions, indicating that there are many floating chips at this time, and the upward momentum is not strong.
② Indicates that the bulls' upward attack is met with resistance and retreat, with heavy selling pressure at the upper levels. Whether it can continue to rise is still unclear.
J. Upper shadow bearish line:
When appearing in a high price area, it indicates that there is severe selling pressure, the market is weak, and there is a possibility of a price reversal downward; if it appears during an upward trend in a medium price area, it indicates that there is still room for further upward movement.
No-shadow bullish line, no-shadow bearish line.

K. No-shadow bullish line:
Indicates strong upward momentum, but there is disagreement between bulls and bears at high price levels, so caution is advised when buying.
L. No-shadow bearish line:
The appearance of a no-shadow bearish line indicates that although the cryptocurrency price has rebounded, the selling pressure above is heavy. The bears take advantage of the situation to push the price down, resulting in a bearish line.
No-shadow bullish line, no-shadow bearish line.

M. No-shadow bullish line:
① The bulls have gained the upper hand, and a wave-by-wave upward trend appears, with prices steadily rising in conjunction with trading volume, indicating bullish prospects ahead.
② Similarly, if a no-shadow bullish line shows that the price has been sideways or declining for most of the time and then suddenly rises at the end, it may indicate a gap up followed by a decline.
③ If the price trend shows a wide fluctuation throughout the day and closes strongly with a bullish line at the end, it may indicate that the main force has driven away those who are holding positions through oscillation, then easily lifted the price, and the market may continue to be bullish.
N. No-shadow bearish line:
In contrast to the no-shadow bullish line situation mentioned above, it indicates a high possibility that the price will fall.
No-shadow no-foot bullish line, no-shadow no-foot bearish line.
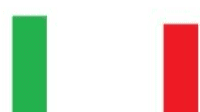
O. No-shadow no-foot bullish line:
Indicates that the bulls have firmly taken control of the market, pushing upward wave by wave, exerting strong upward pressure.
P. No-shadow no-foot bearish line:
When the price of a cryptocurrency is sideways, and suddenly there is a surge in volume towards the end of the trading session, it indicates that the bears have ultimately gained the dominant advantage in the battle, and there is a higher possibility of a gap down at the opening.
If the price is showing a wave-by-wave downward trend, it indicates that the bears have taken the upper hand, the bulls are unable to resist, and the price is being gradually driven lower, suggesting a bearish outlook ahead.
T-shaped line, inverted T-shaped line.

Q. T-shaped line:
When appearing in a low price area, it indicates that there is strong support below, and the price has a possibility of rebounding.
R. Inverted T-shaped line:
When appearing in a high price area, it indicates that there is severe selling pressure, the market is weak, and there is a possibility of a price reversal downward.
If it appears during an upward trend in a medium price area, it suggests there is still room for further price increases.
Doji.
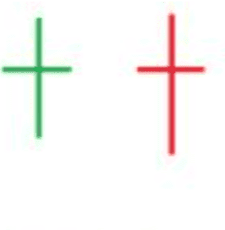
S. Doji:
This line type is commonly referred to as a reversal doji; regardless of whether it appears in a high or low price area, it can be seen as a signal of a top or bottom, indicating a major change in trend is about to occur.
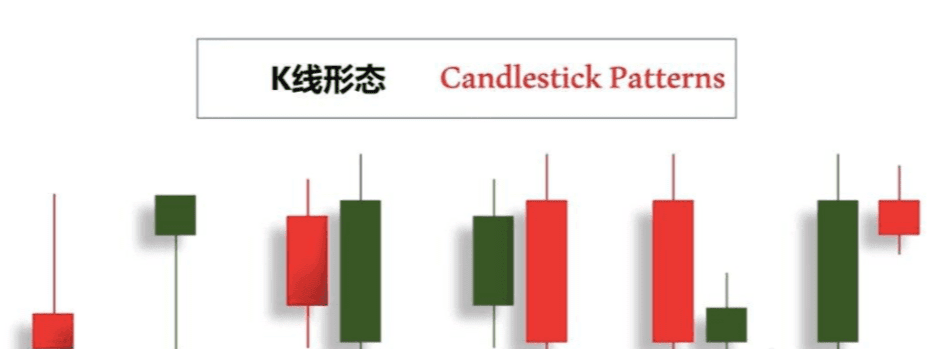
Summary of candlestick types.
In addition to subdividing candlesticks into 19 categories, we can also classify candlestick types based on their bodies and shadows, mainly dividing them into four major categories.
①: A candlestick without upper or lower shadows is referred to as a no-shadow no-foot candlestick.
Indicates that one side has the upper hand in the market and dominates the trading.
②: Small bearish and bullish bodies without upper or lower shadows.
Closing price is the highest or lowest price, opening price is the lowest or highest price, with limited fluctuations; the battle between buyers and sellers is not intense. When the candlestick is a bullish line, the buyers have a slight advantage; when it is a bearish line, the sellers have a slight advantage. It generally appears during price consolidation or when prices gap down or up. It is not very significant during consolidation, but when there is a large gap, its significance is extraordinary, indicating that one side has achieved a comprehensive victory while the other side has collapsed.
③: A large bullish line with no upper or lower shadows.
Most often appears during the rise of the cryptocurrency market, where prices continue to rise, and although there are pullbacks, they quickly recover and buyers are determined to push the prices higher.
④: A large bearish line with no upper or lower shadows.
Most often appears during the decline of the cryptocurrency price, meaning exactly the opposite of the above.
In the digital currency market, technical analysis is a crucial indicator for predicting short-term price trends, commonly referred to as candlestick charts. Regardless of whether you believe or advocate for technical analysis, understanding candlestick charts is essential.
Not understanding candlestick patterns and randomly trading is a big taboo in the cryptocurrency world! Excluding technical issues related to patterns, indicators, and the battle between bulls and bears, the basic information such as price trends, trading volume, lowest point, and highest point can all be reflected in the candlestick chart.
Candlestick patterns.
Relying on candlestick patterns to provide us with dual protection gives us confidence.
Triggering our trades makes it equally important to master candlestick patterns.
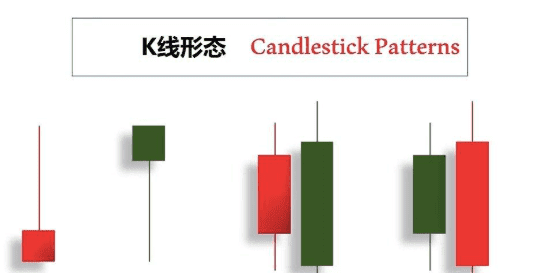
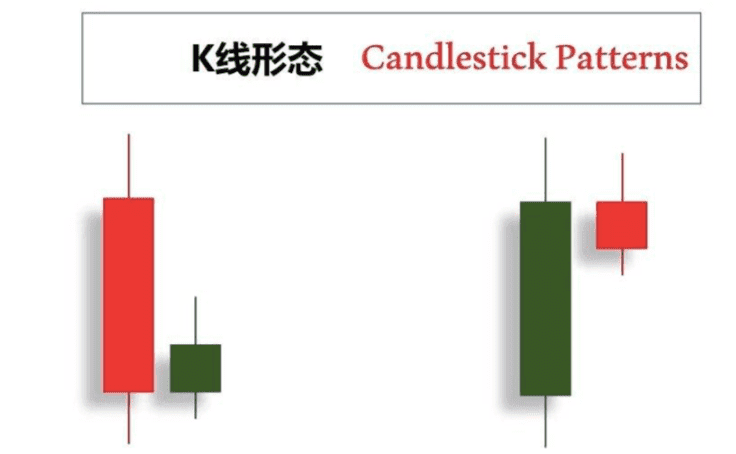
A bullish engulfing line consists of one bearish line followed by a very small bullish line, which is within the previous candlestick, whether in body or shadow.
The bearish engulfing line is the opposite, where both the body and shadow of the bearish line are within the previous bullish line.
Generally speaking, there are two common methods to trade using this pattern.
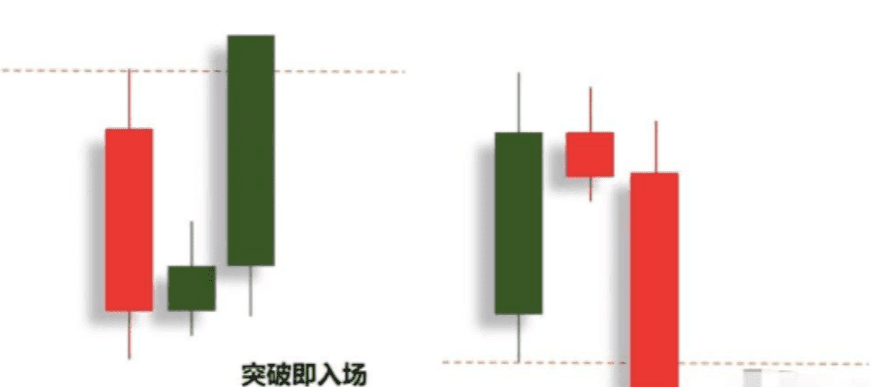
The first, when the price breaks through the high or low of the previous candlestick, regardless of whether the latest candlestick has ended, we will enter the market to buy or sell, which is considered left-side trading.
The second, more conservative approach is to wait for the current candlestick to confirm the high or low of the previous candlestick before entering the market.
Part Three: Chart Patterns.
You will find that the market constantly tries to do one thing through repeated patterns, and chart patterns provide a trace that allows us to follow the market's current actions and the logic behind it.
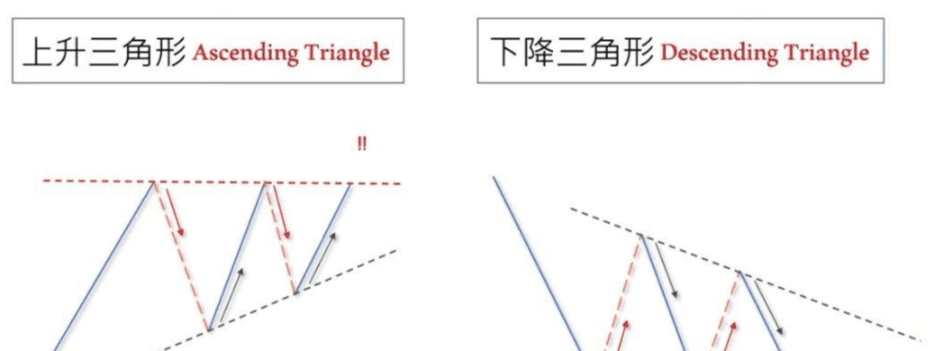
Chart patterns that are often seen in the market.
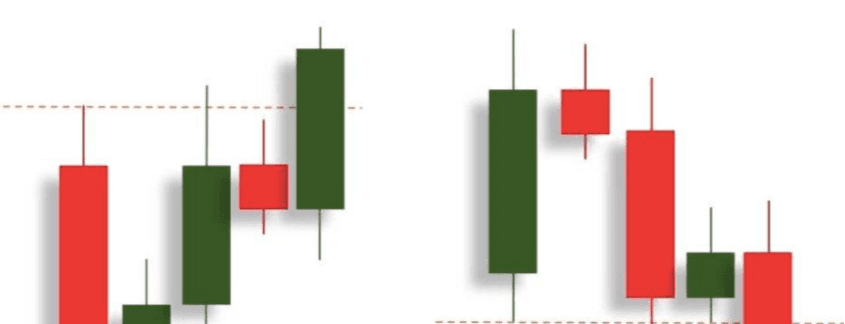
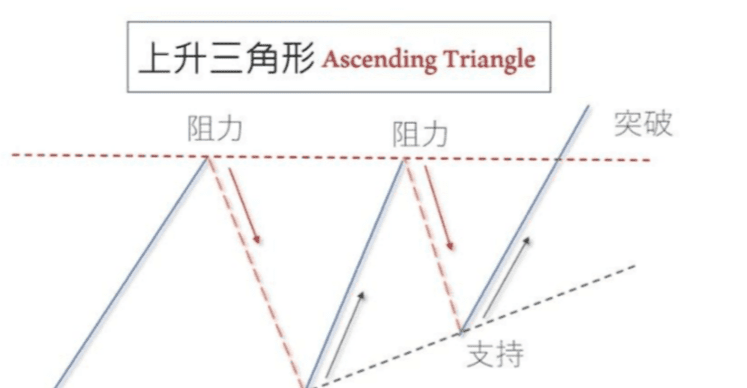
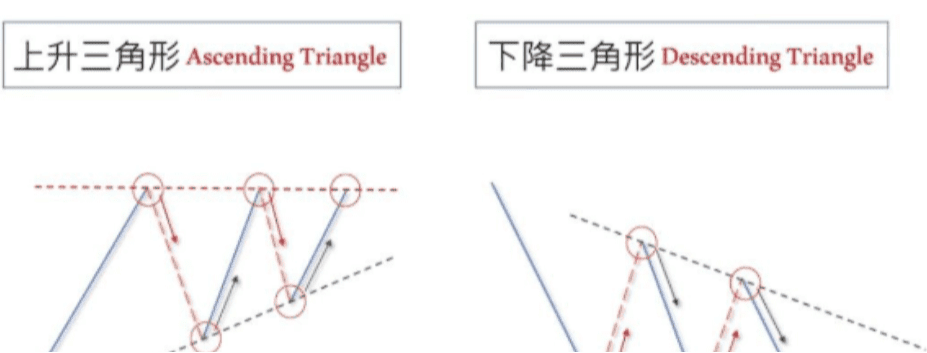
Ascending triangle.
Descending triangle.
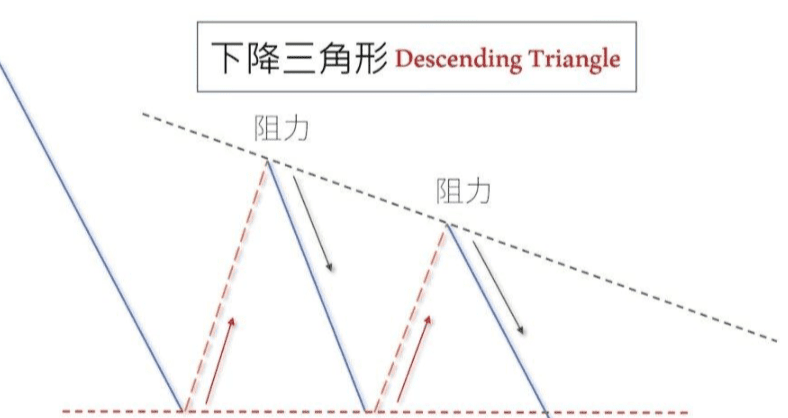
The descending triangle is similar; the impact of horizontal support on price is that each breakout is smaller than the previous one, and ultimately it breaks through successfully, continuing a downward trend.
In a prolonged bear market, where is the end? In the current market situation, many people have reached their limits; the choices they face are two: first, to stop moving forward and exit the cryptocurrency market; second, to endure and wait for the next bull market to begin.
Only a small number of people can survive in a bear market; a bull market is like a wind tunnel, where even pigs can fly, while a bear market is a battleground where survival of the fittest prevails. So how can one survive in a bear market?

Lock up your positions, stay away from the cryptocurrency market, and wait for the next bull market to return. This rule requires a high level of self-discipline; very few people can truly ignore it, and those who can do are not ordinary people.
Regular investment to reduce risk. Suitable for those who have made small investments in the early stages, have relatively stable personal income, and expect future returns to not be low.
Choose the right time to bottom fish. This risk is also significant; it’s easy for novices to buy at the midpoint, turning short-term trades into long-term ones, which is not something an average person can do well.
Short-term operations, buying high and selling low. Risk level five stars, greater than the fourth type. Those who do this well will not be caught in a bear market.
Cut losses and stay away from the cryptocurrency market, don’t look back. The downside of this rule is that if you sell at the end of a bear market and immediately follow it with a bull market, you will regret it for a lifetime. To avoid lifelong regret, this approach is not recommended.
How should we invest and trade in a bear market?
1: Adhere to a long-term investment plan that aligns with financial goals.
For investors, whether in a bear or bull market, it is essential to stick to a long-term investment plan. During bear markets, there is a lot of pessimistic information online, but it is best to ignore this market noise and focus on the returns of long-term investments. Some short-term traders will quickly change their investment strategies to protect capital or expand profits, but the fact is, if you find yourself in a bear market, it might already be too late to change asset allocation.
2: Avoid timing the market for entry and exit.
Retail investors often make the mistake of trying to avoid the bear market by selling positions. Exiting at highs and entering at lows seems simple, but it is not easy. Even if they sell positions before a decline, investors may not be able to capture the timing for re-entry, as the market often surges when it is least expected. Looking back at history, retail investors who exit during a bear market miss opportunities to maximize asset returns.
3: Never try to guess the top or bottom.
In a bear market, investors often want to sell all at once, but in fact, selling in batches may be a better choice. Don't try to assess the timing of entry and exit; relatively speaking, the average cost method (whether buying or selling) is more suitable.
4: Accumulate cryptocurrencies.
Regular investment to accumulate cryptocurrency. Most chips in the market are very cheap; accumulating cheap chips during a bear market will turn into profitable chips in the next bull market.
5: Strengthen theoretical learning and explore potential cryptocurrencies.
Learning is the key to continuous improvement. This circle is ever-changing, with projects emerging one after another and technology constantly updating and iterating. Without learning, one will only be eliminated. In this bear market, strive to learn and accumulate, as this will serve as chips for future battles.
This is the trading experience that Xiao Xun shares with everyone today. Many times, you lose many profitable opportunities due to doubt; if you don’t dare to try boldly, reach out, and understand, how can you know the pros and cons among them? You only know the next step when you take the first step. A warm cup of tea, a piece of advice, I am both a teacher and a friendly conversational partner.
Meeting is fate, knowing is destiny. I firmly believe that those who are destined will meet despite a thousand miles; those who miss each other are meant to be. The road of investment is long, and temporary gains and losses are just the tip of the iceberg. Remember that even the wisest must have a miscalculation, while the foolish may occasionally succeed. Regardless of emotions, time will not stop for you. Pick up the worries in your heart and stand up again to move forward.
Xiao Xun only engages in real trading; the team still has spots available for joining.

