Chainlink (LINK) has had an impressive August. Despite Bitcoin's continuous fluctuations, the bulls of LINK have remained strong, recording a 43.8% increase in just the last 30 days.
On-chain pressure is increasing
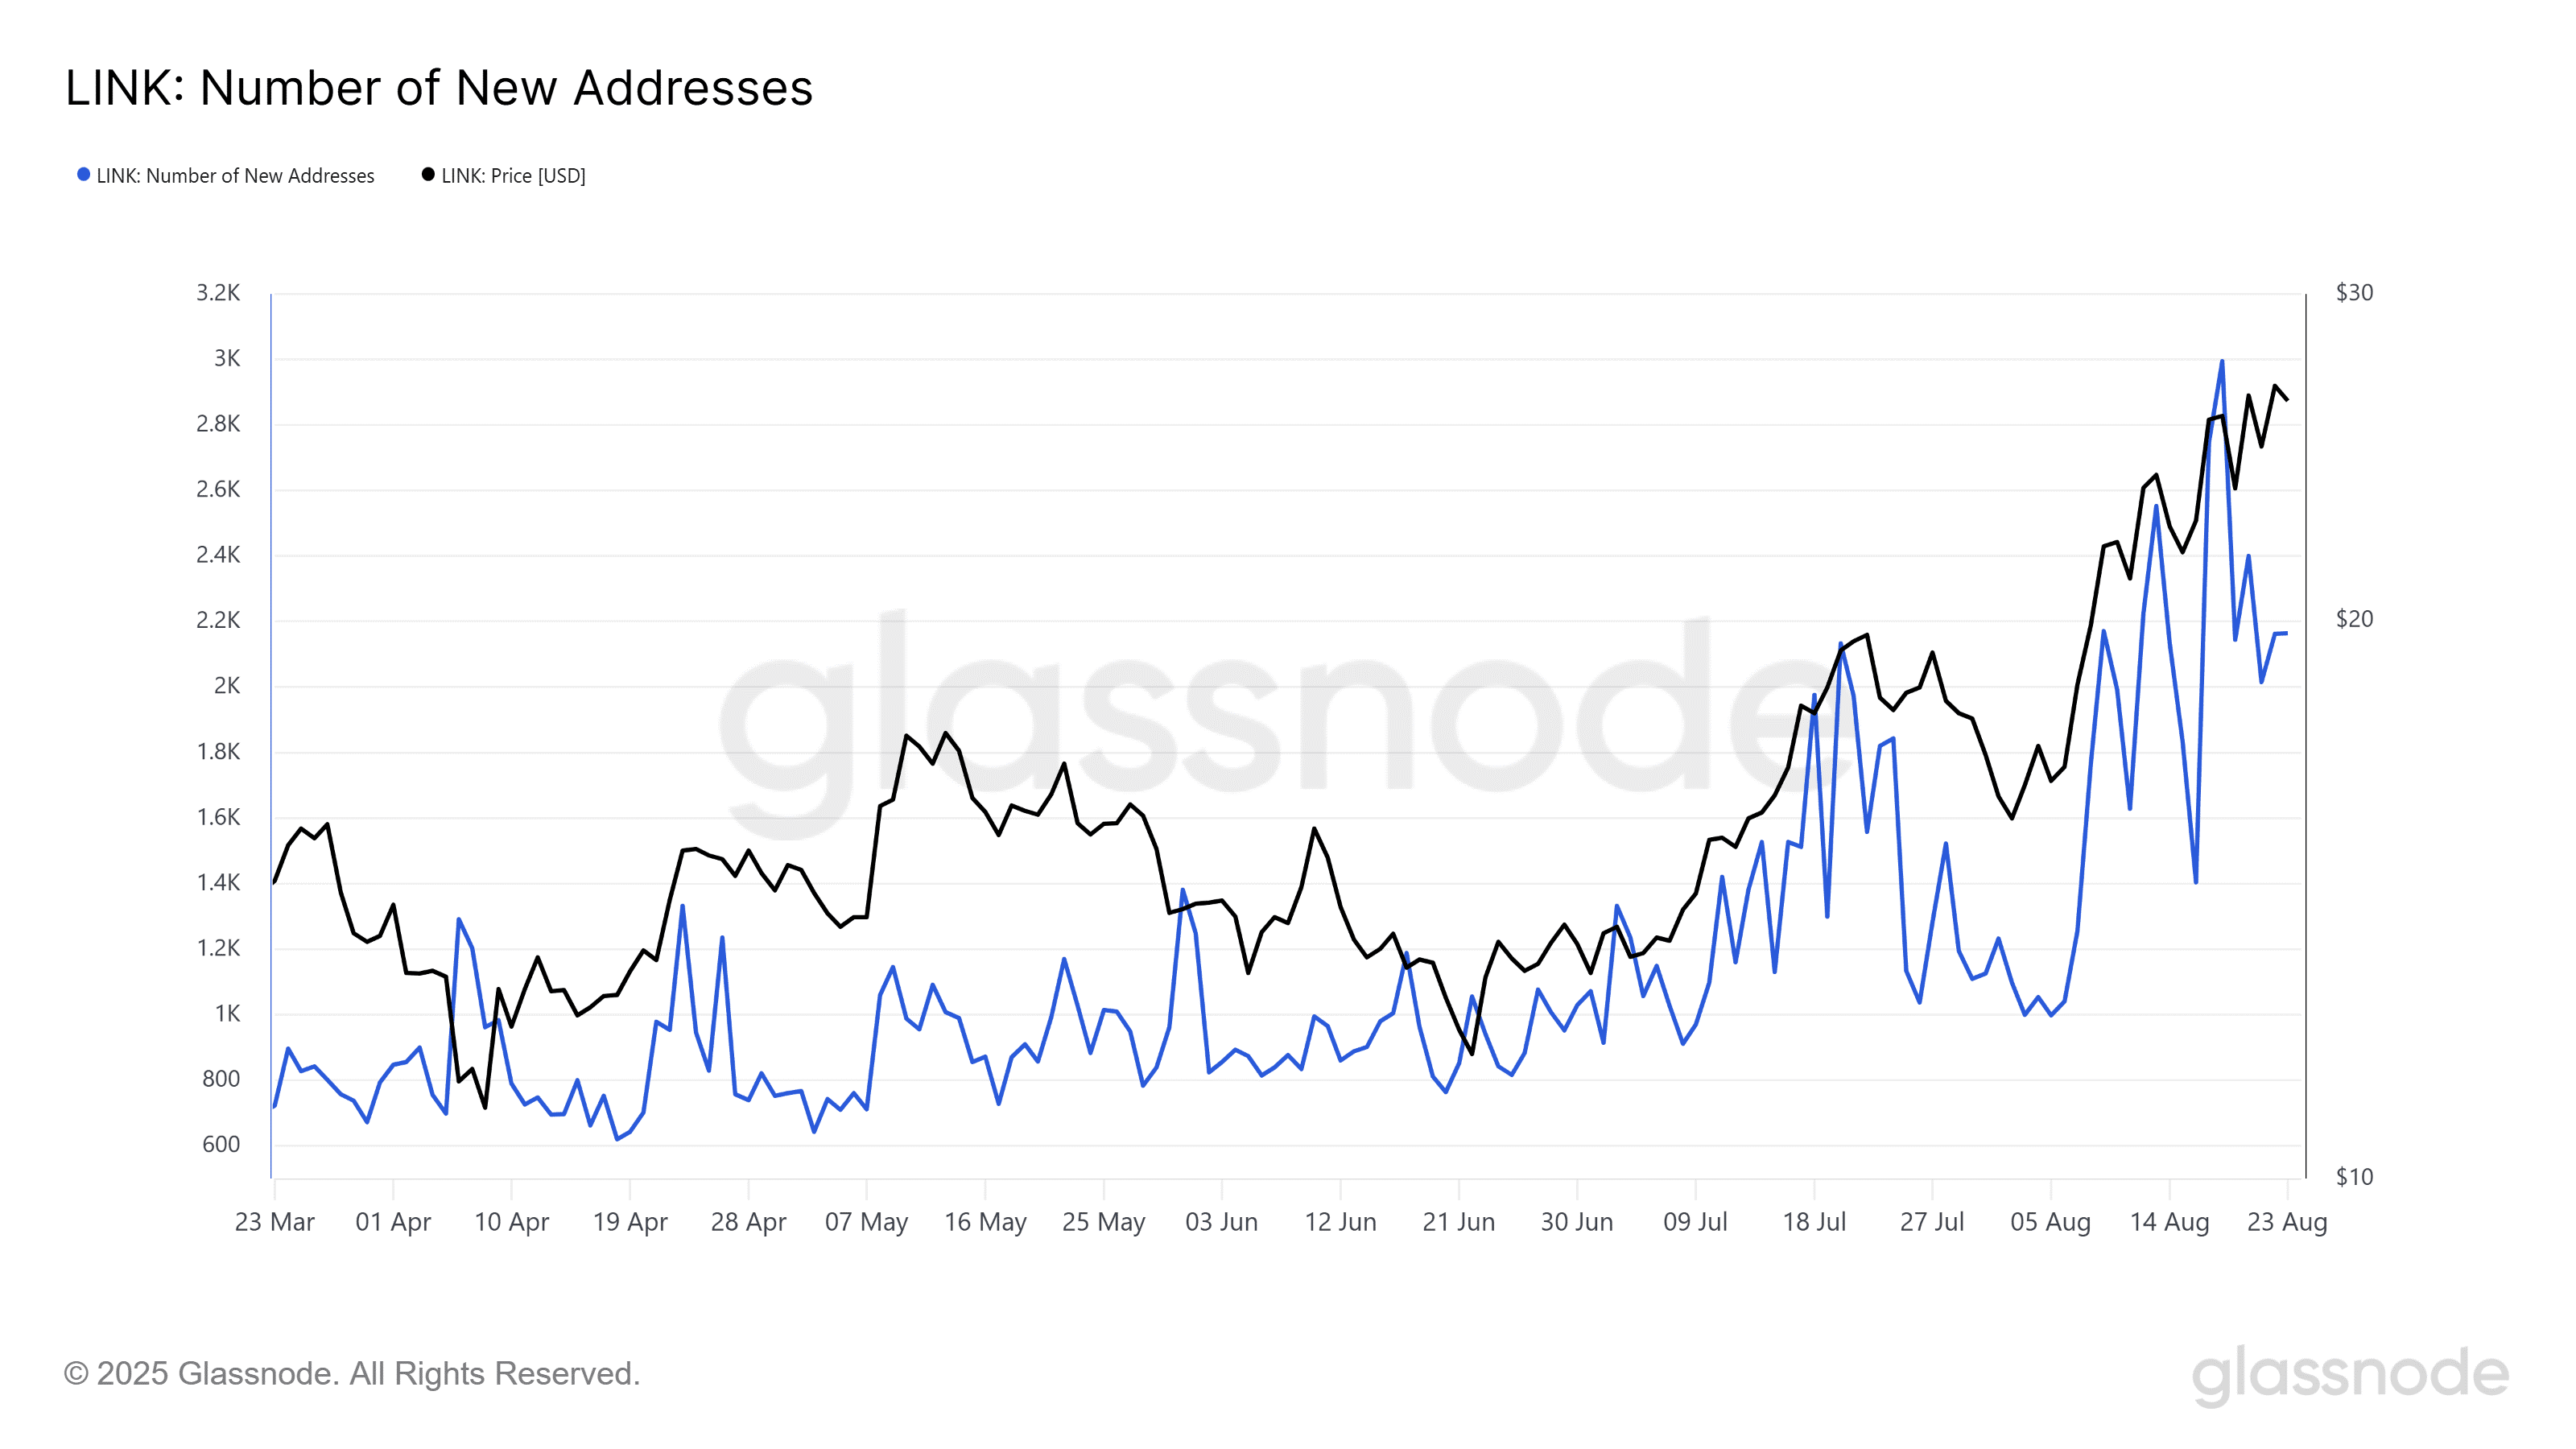
The optimistic sentiment is the driving force behind the increasing on-chain activity. According to data from Glassnode, the number of new addresses has continuously increased since June. At the time of writing, this number reached 2,163, nearly equal to the levels recorded in November 2024.
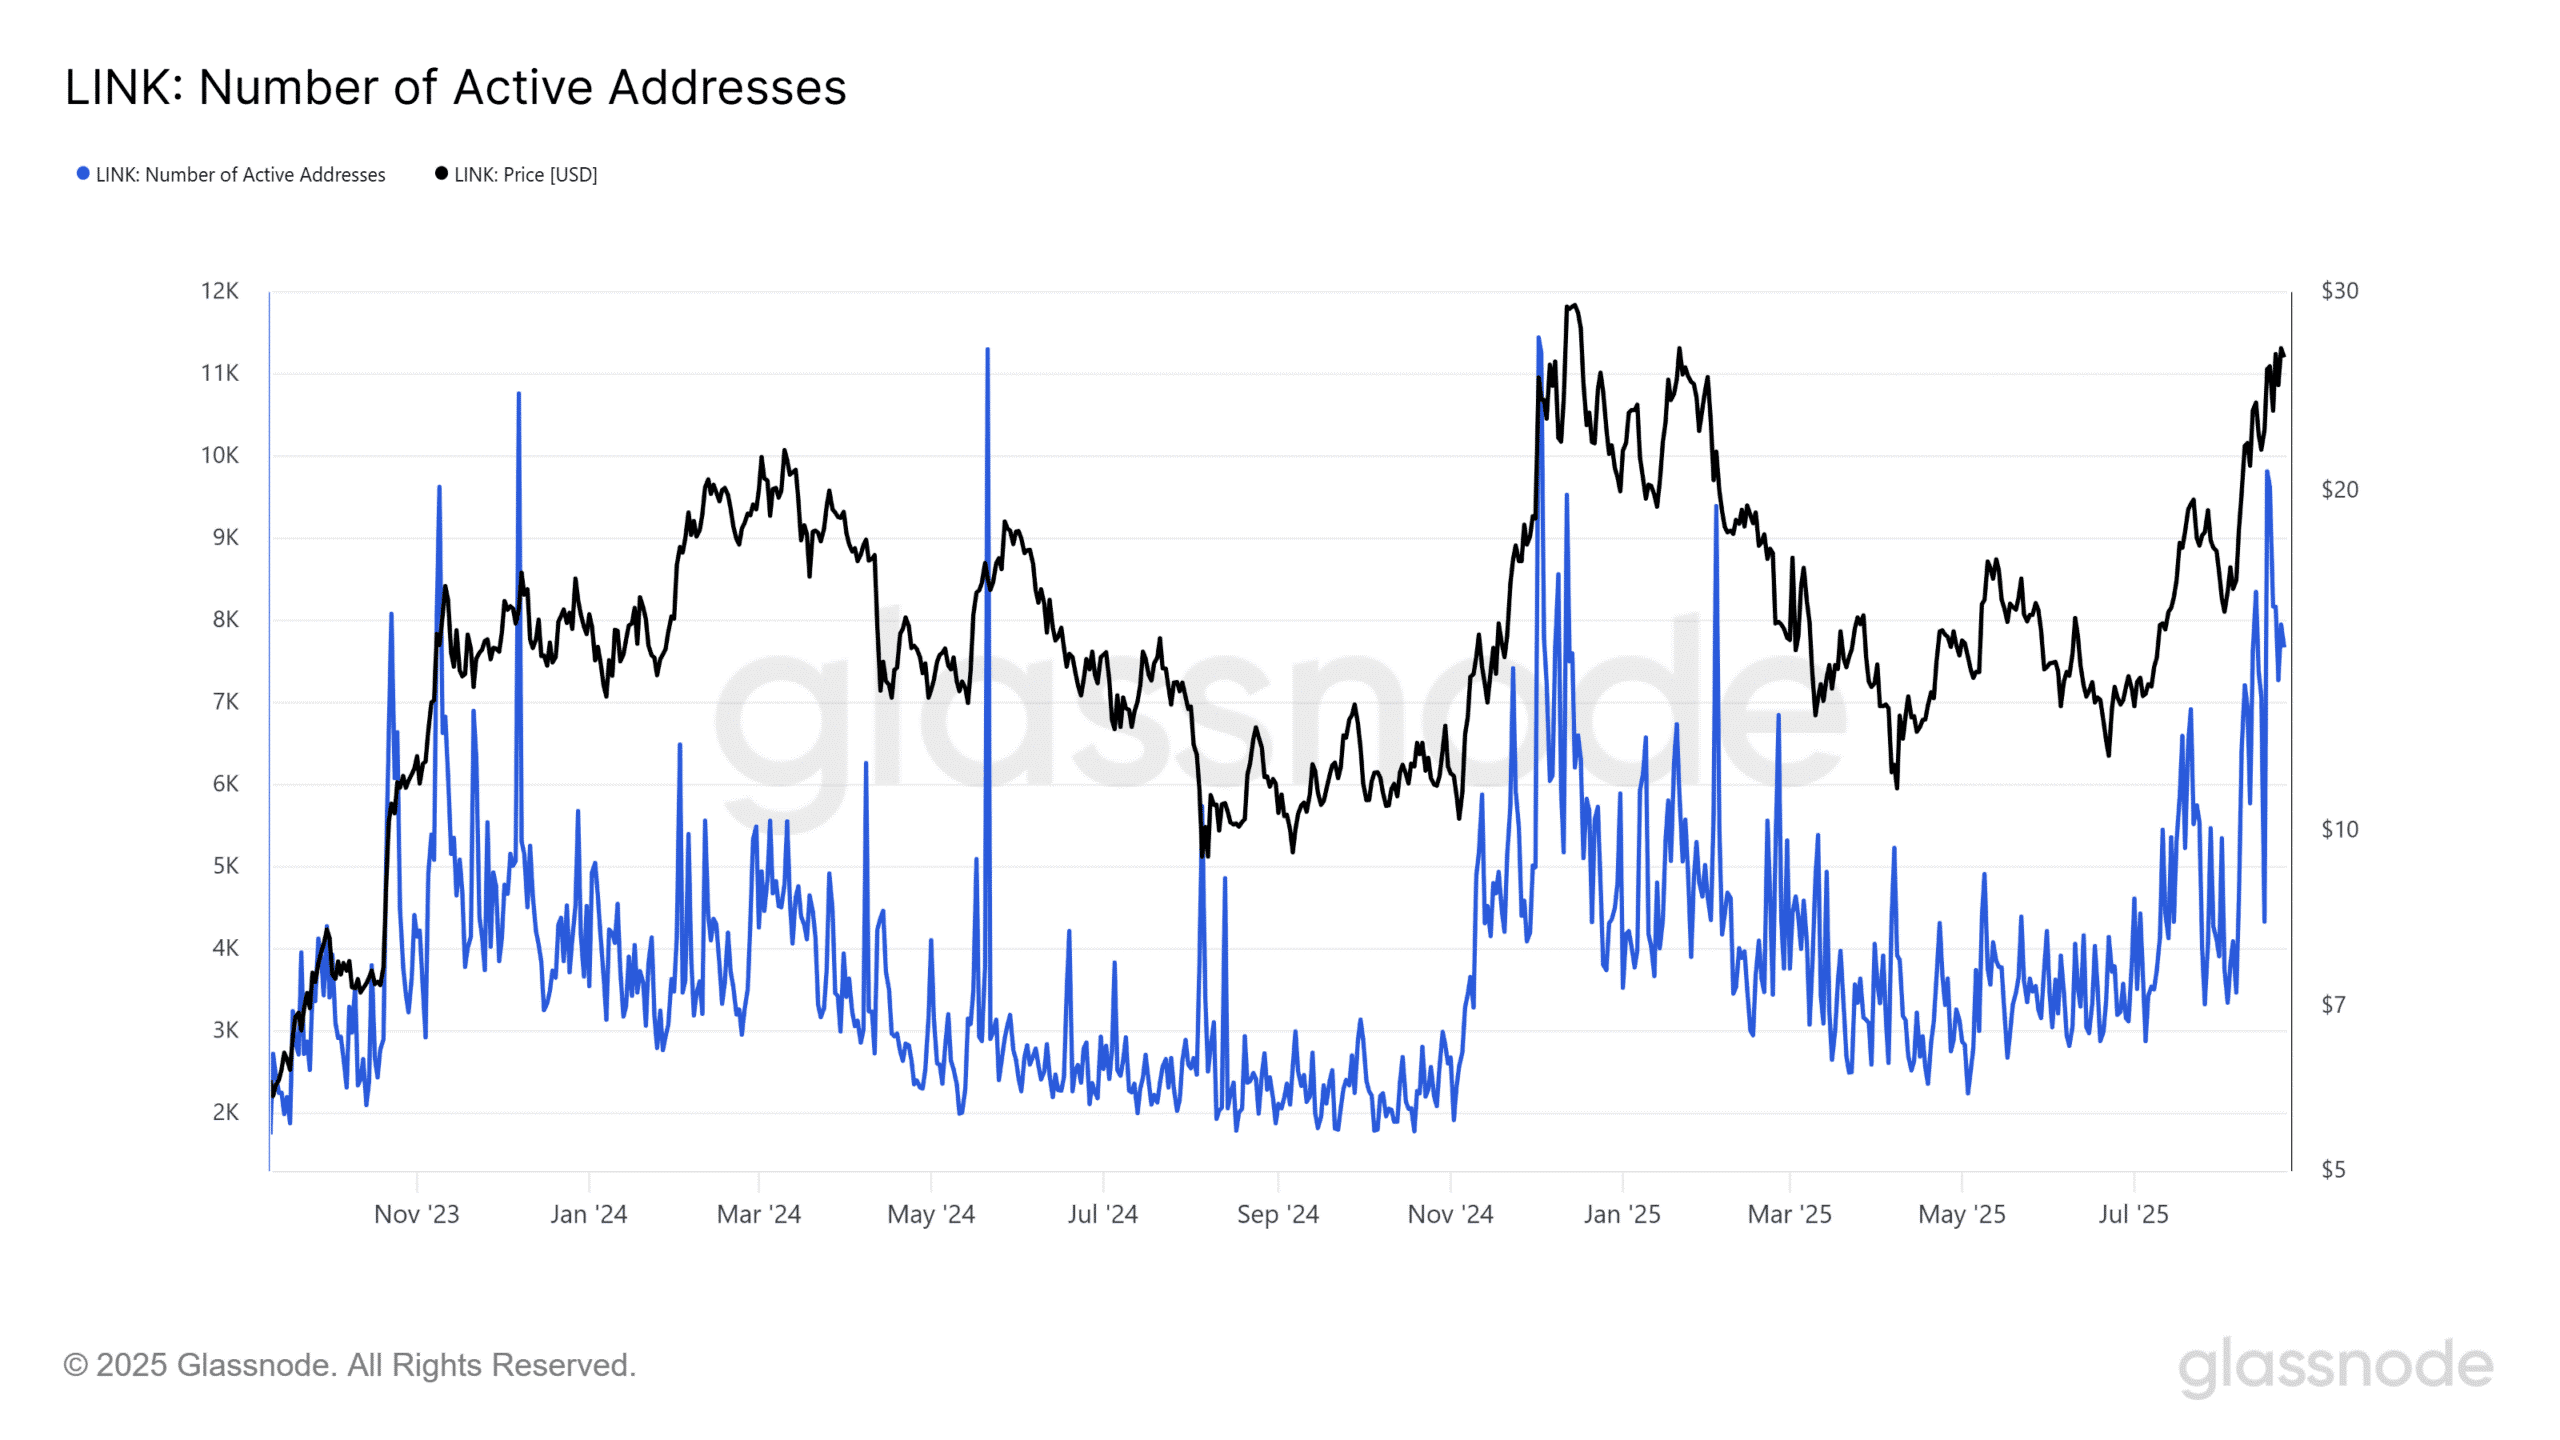
Similar to the number of new addresses, active addresses are also on the rise, approaching the levels recorded in November 2021. Overall, increasing network activity is a positive signal for investors and long-term holders. Although at first glance, this may be seen as a warning, if history repeats itself, Chainlink's upward trend is likely to continue.
This does not mean that a surge is guaranteed to happen, but it is certainly very possible. Furthermore, if Bitcoin and Ethereum (ETH) continue to be taken for profits, new capital may flow into LINK, reinforcing the upward trend.
Other signals suggest LINK may continue to increase in price
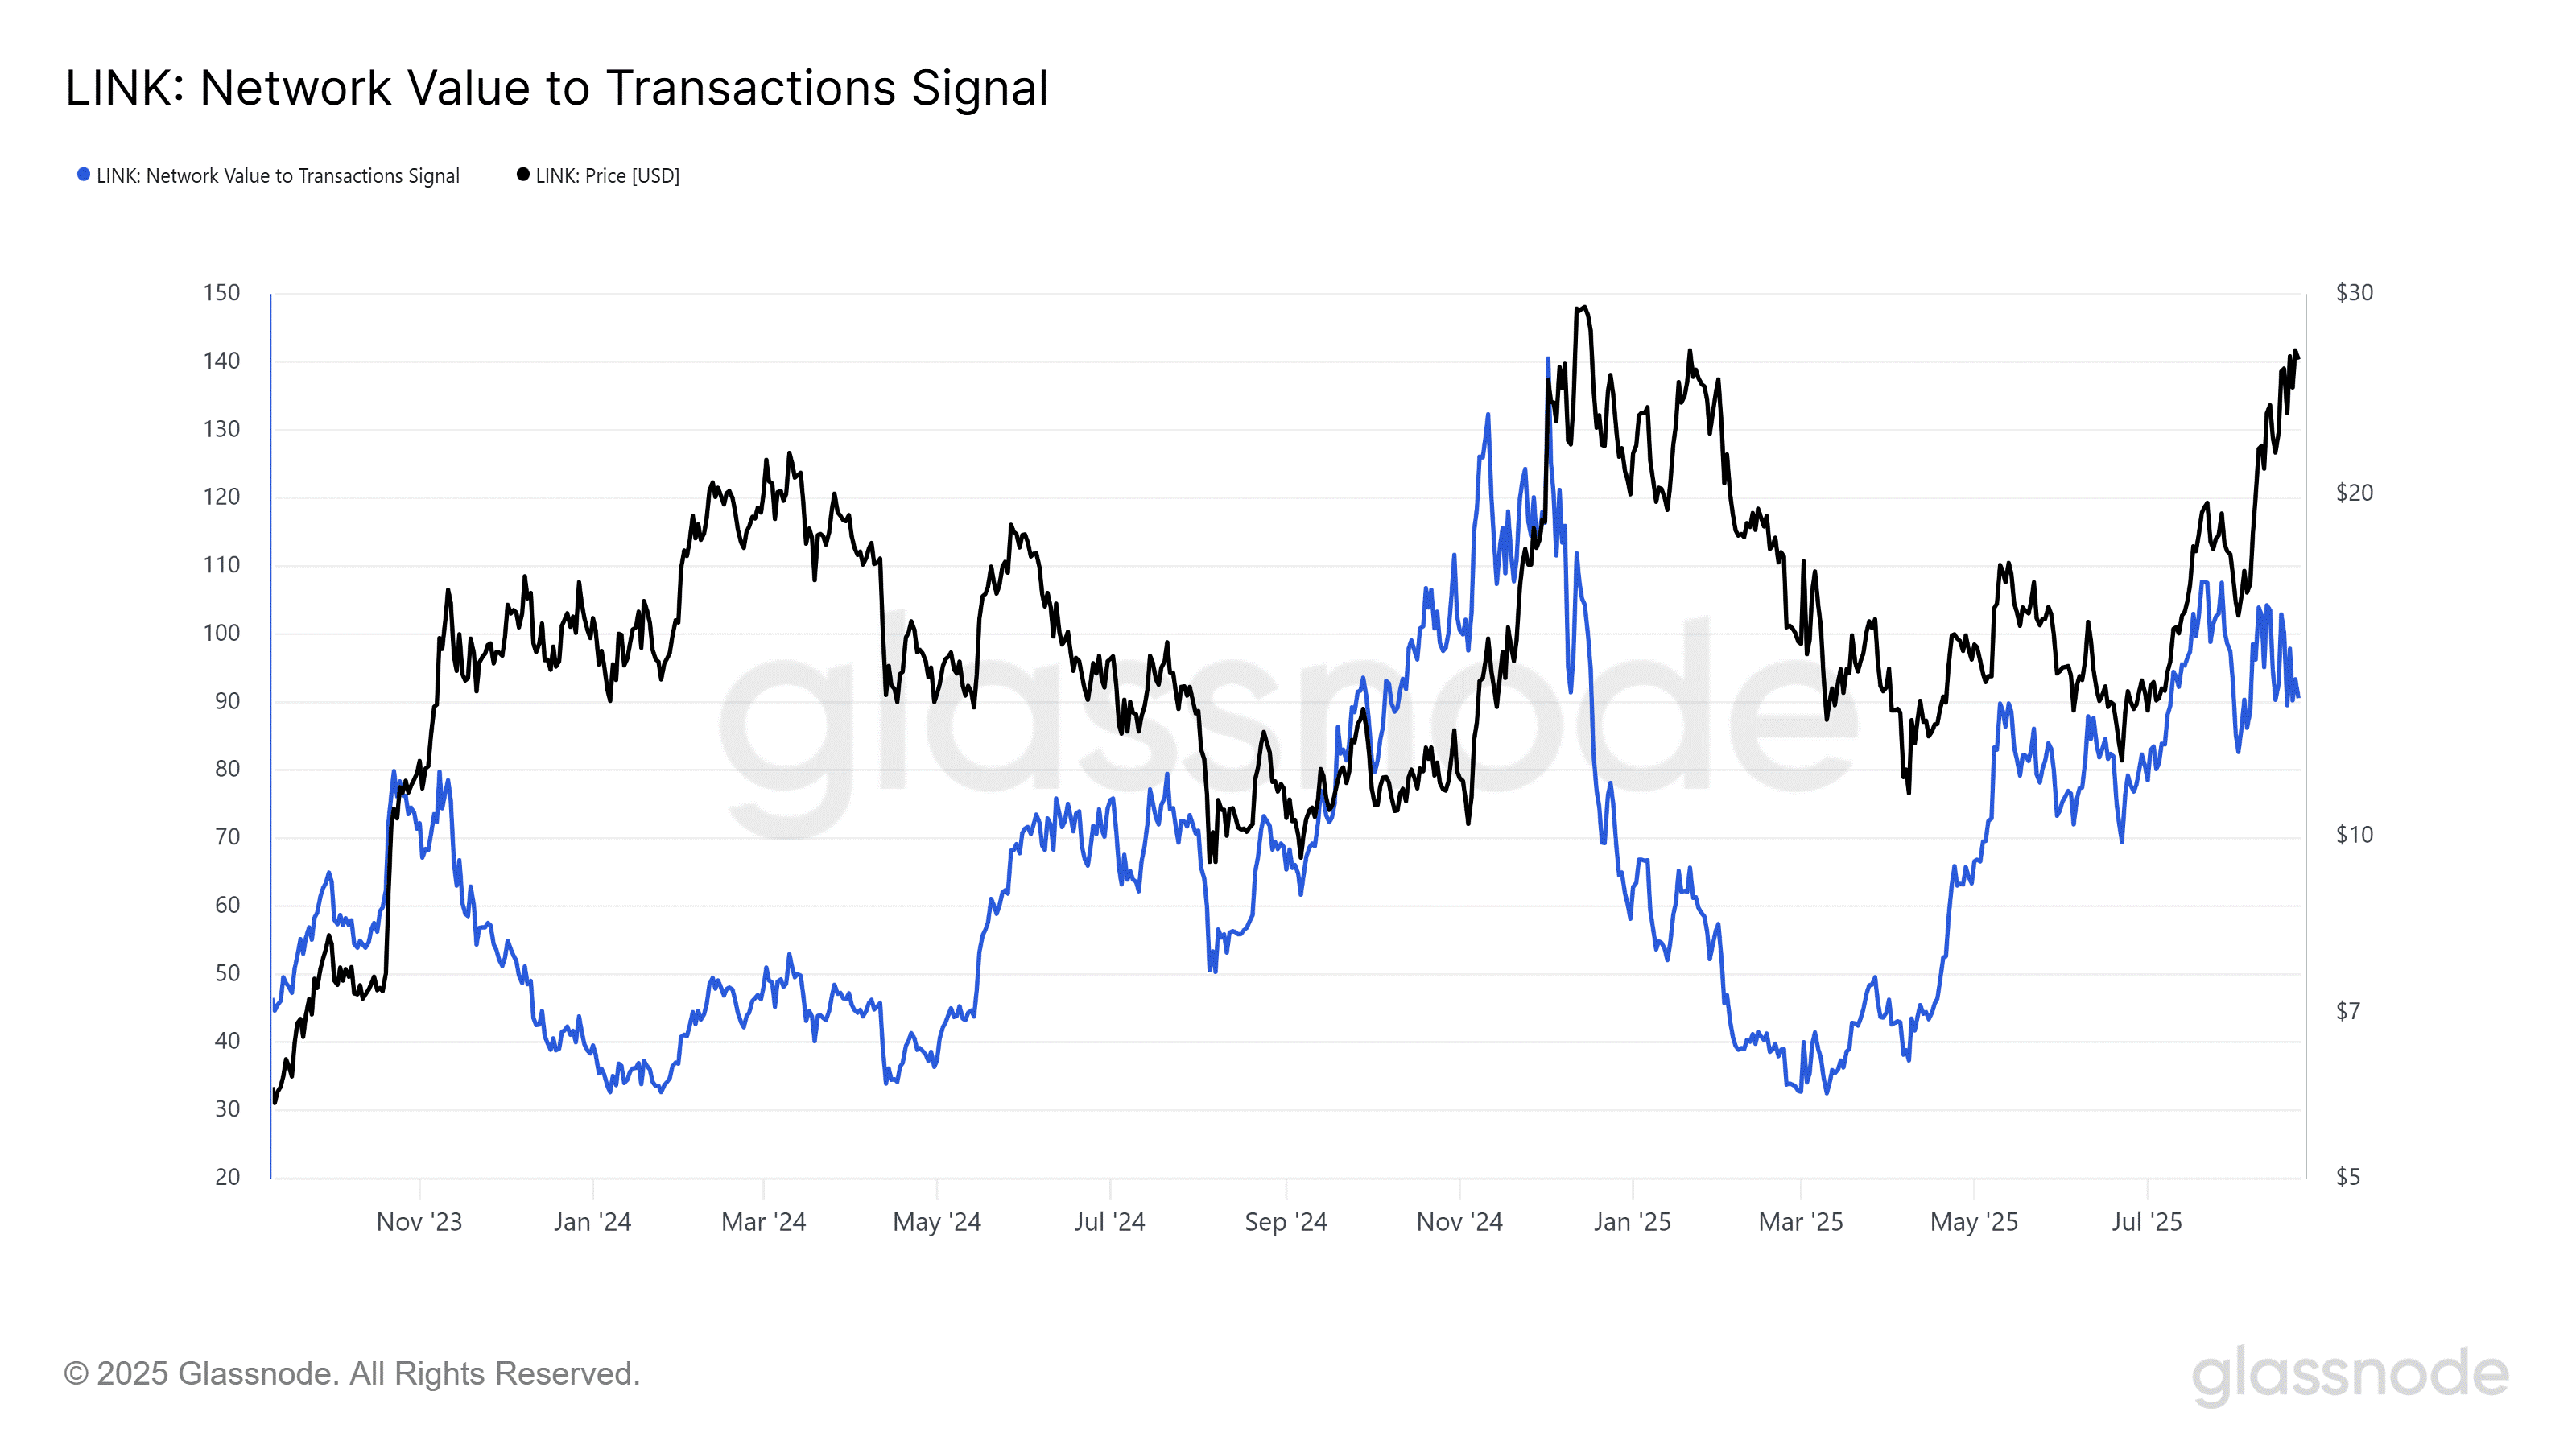
The Network Value to Transactions ratio (NVT) compares the market capitalization of an asset to its daily trading volume. When NVT is low, it indicates that the asset is undervalued compared to its level of utility. The NVT Signal indicator adjusts this measure by using a long-term moving average (e.g., 90 days) of daily trading volume.
For LINK, the current NVT is at a level similar to early November 2024, when the price surge from $10.56 to $29.26 began. In fact, this is also one of the reasons that makes the outlook for Chainlink's continued price increase compelling.
The LINK chart still holds the support zone
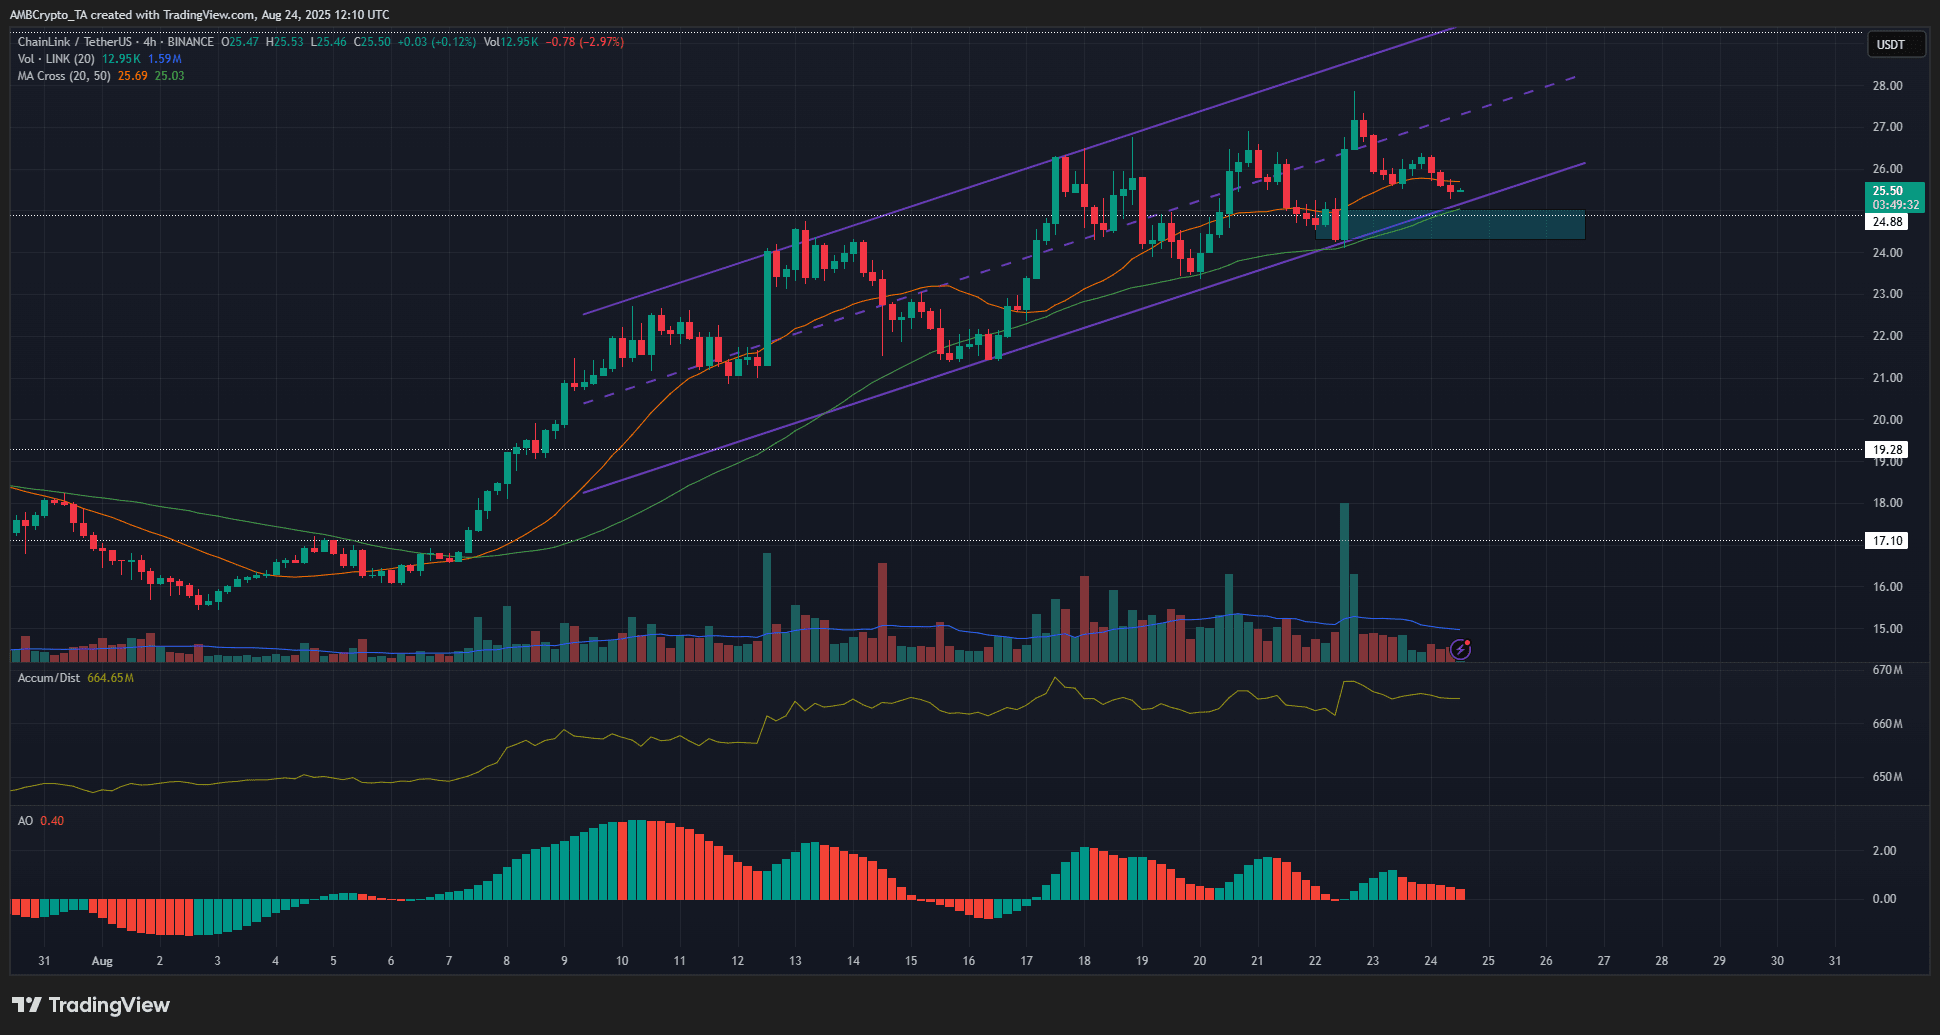
To predict the direction of LINK in the coming days, the 4-hour chart has been thoroughly analyzed. The levels of $24.88 and $29.26 are important horizontal levels on the weekly frame, and they also play a significant support/resistance role on the 4-hour chart.
At the time of writing, the Chainlink token is trading within a rising purple channel. It is above the old resistance level of $24.88 and is preparing to retest this level as a support zone. The moving averages, Awesome Oscillator indicator, and A/D all support the buyers. If the demand zone of $24.3–$25 is maintained, the possibility of LINK advancing to the top of the channel is entirely feasible.