First, look at the daily trend. The daily K line has a second downward drop, breaking through the previous low of 111,684 USD 💲.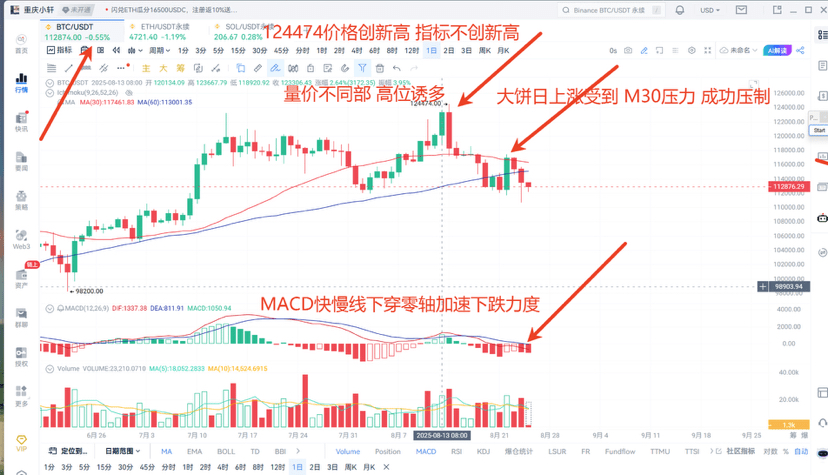
MACD fast and slow lines cross below the zero axis, accelerating downward ⬇️📉 strength.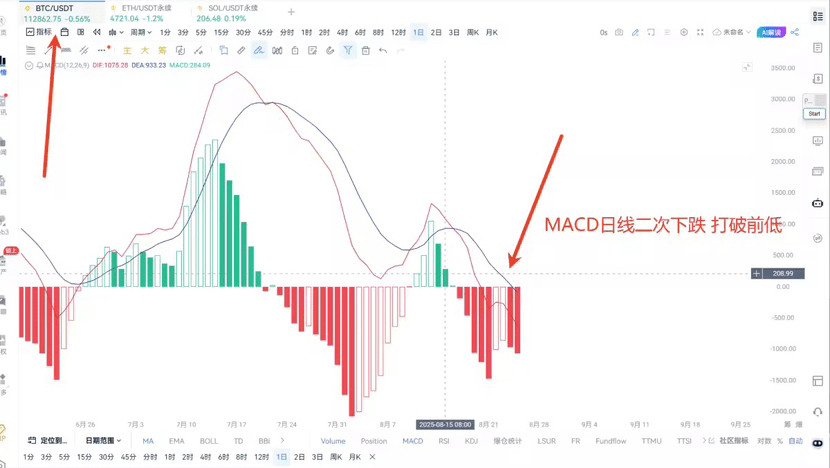
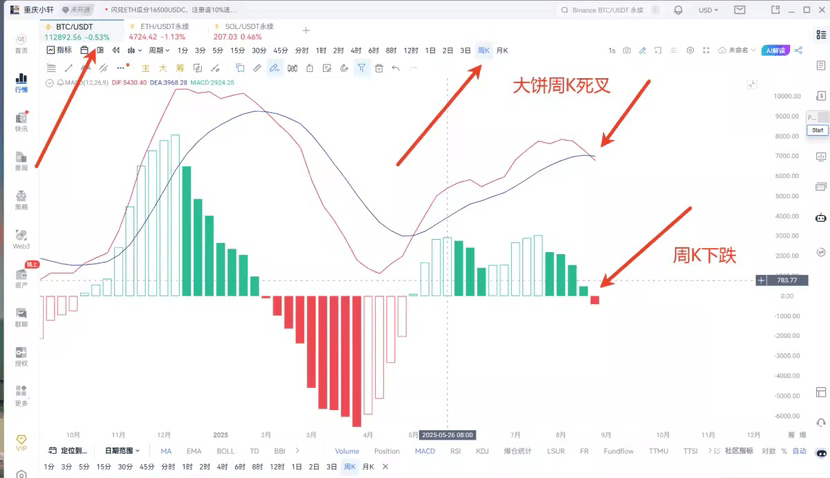
Weekly K line high-level death cross, strong support at the 110,000 mark. Judging by the MACD special pattern, the current Bitcoin market is once again entering a consolidation range of 110,500-117,200. It is possible to go short and long near this position. A drop below 110,000 will trigger a loss, while a breakout above 117,500 will trigger a loss.