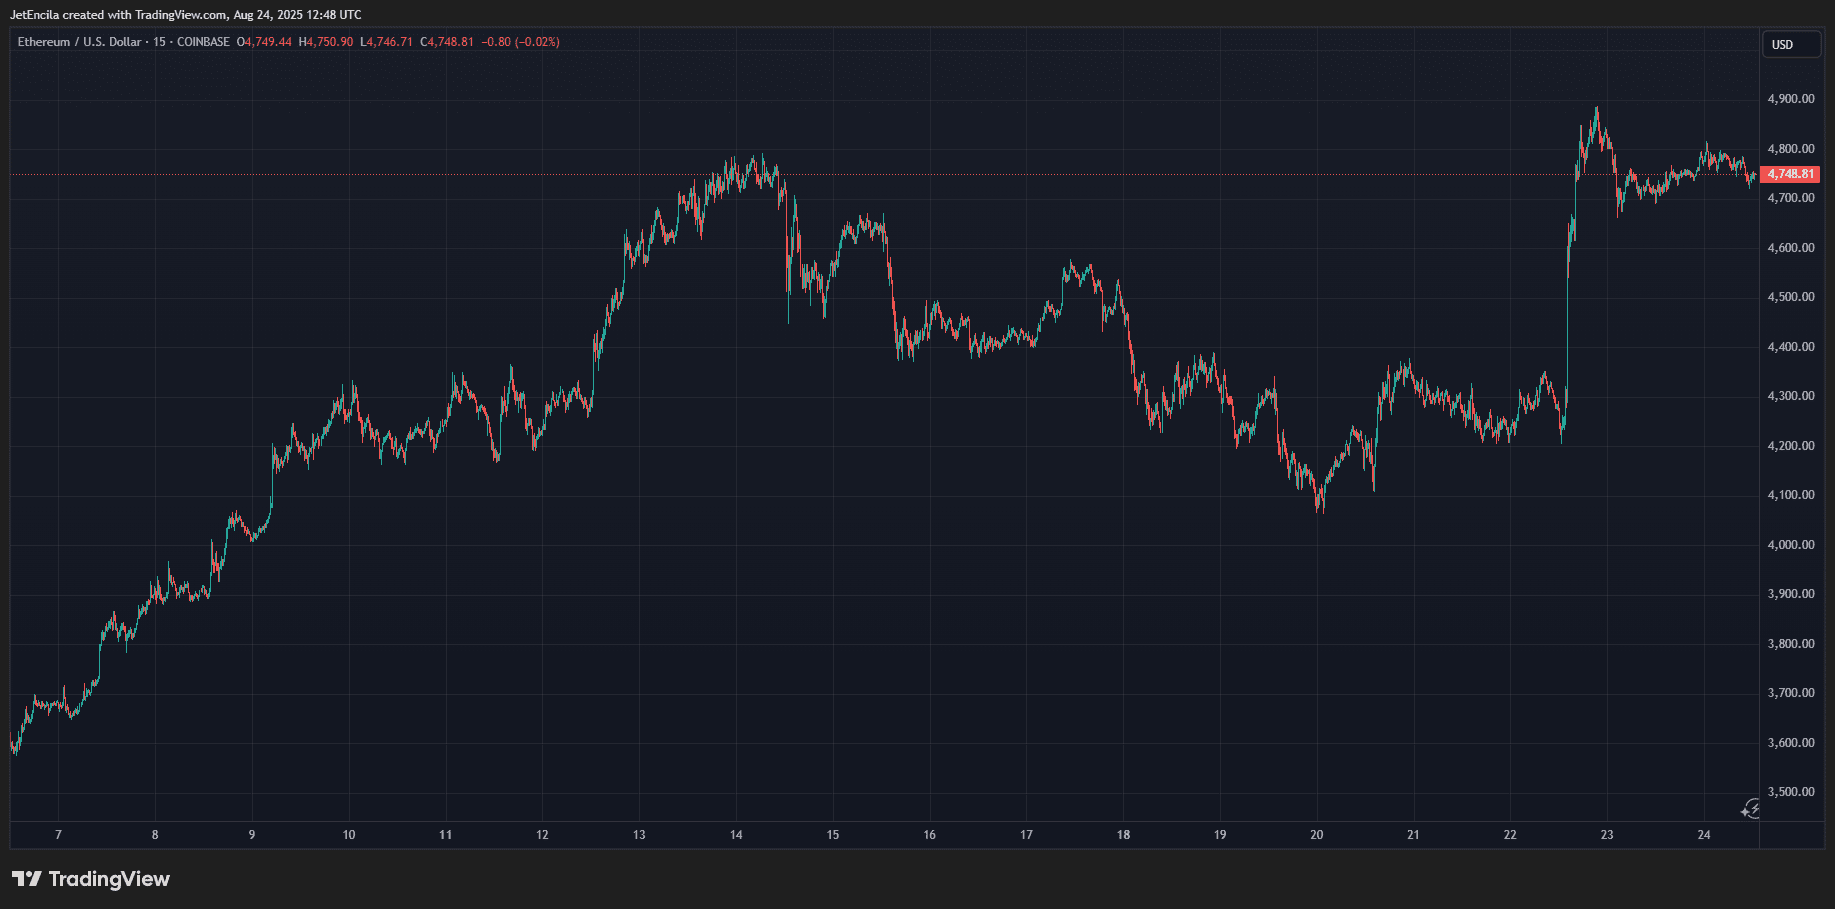
Ethereum has shown strong performance in the past 24 hours, with prices rising close to the previous all-time high. According to data from CoinGecko, ETH has risen to $4,837, just slightly below the 2021 peak of $4,878.
This surge follows Federal Reserve Chairman Jerome Powell's speech at Jackson Hole, where he hinted that the long-anticipated interest rate cuts could happen soon.
Interestingly, Ethereum is not only performing well against the dollar but also against Bitcoin, where technical analysis indicates that the long-awaited structural trend line appears to be breaking in favor of Ethereum.
Analyst Points Out the Breakout of ETH/BTC
According to a recent technical analysis revealed for the first time on the social media platform X by cryptocurrency analyst Ted Pillows, Ethereum is about to have an impressive performance compared to Bitcoin. Ted Pillows notes that the breakout of ETH/BTC has finally occurred after nearly eight years of continuous rejection by the resistance level.
Analysis based on the 2-week (2W) timeframe of the ETH/BTC pair shows that Ethereum's price action has broken the long-term downtrend line that has existed since 2017. At the time of analysis, the ETH/BTC pair was trading around 0.04077 after Ethereum's price increased by 7%.
Interestingly, the chart shows that the ETH/BTC pair has repeatedly attempted to break above this downtrend line but has not succeeded. Most recently, this currency pair approached the trend line again, starting in July 2025 and has been ongoing for the past few weeks. The last 2-week candle currently shows that the ETH/BTC pair has risen above the trend line.
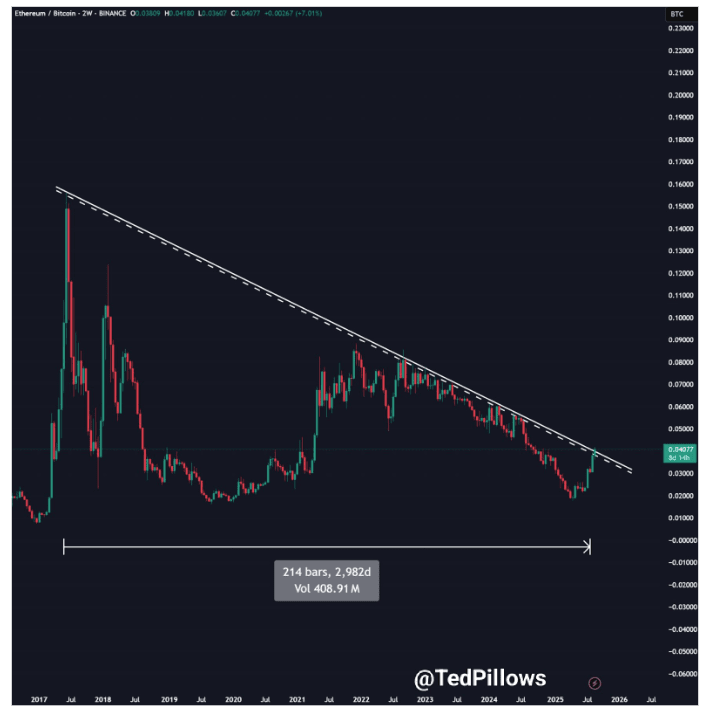
However, Pillows has tempered his optimism with a warning: "I just want a 2-week confirmation above this level, and you would be surprised to see Ethereum rise," he said. This means that confirmation is crucial for Ethereum to continue outperforming Bitcoin. A breakout will be confirmed when the 2-week candle closes above the resistance level, and this could then turn the previous downtrend into a support zone for the ETH/BTC pair.
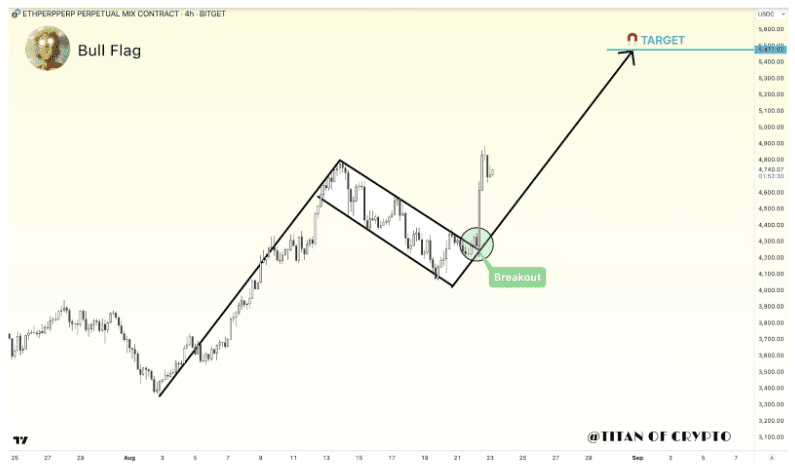
Bull Flag Target Value of 5,400 USD
Another analyst, Titan of Crypto, has noticed a bullish setup on the short-term 4-hour ETH/USD chart. Technical analysis of the 4-hour candlestick chart shows that Ethereum is currently breaking out of a clear bullish flag pattern, a continuation pattern that often appears in the middle of a trend.
The breakout, which has already occurred, began when Ethereum surpassed the $4,200 mark in August. Analysts predict the price target will be around $5,400 to $5,477, meaning Ethereum could not only retest but also surpass the previous all-time high and enter a new price range above $5,000.