
The financial market is not random as it appears to the public; rather, it is governed by recurring cycles that blend the behavior of the Smart Money and the emotions of the crowd.
And by integrating Wyckoff schools – market psychology – the parabolic curve – Gann squares, we obtain an accurate map revealing the current phase and what follows.
1️⃣ Wyckoff Theory: Distribution Under the Microscope
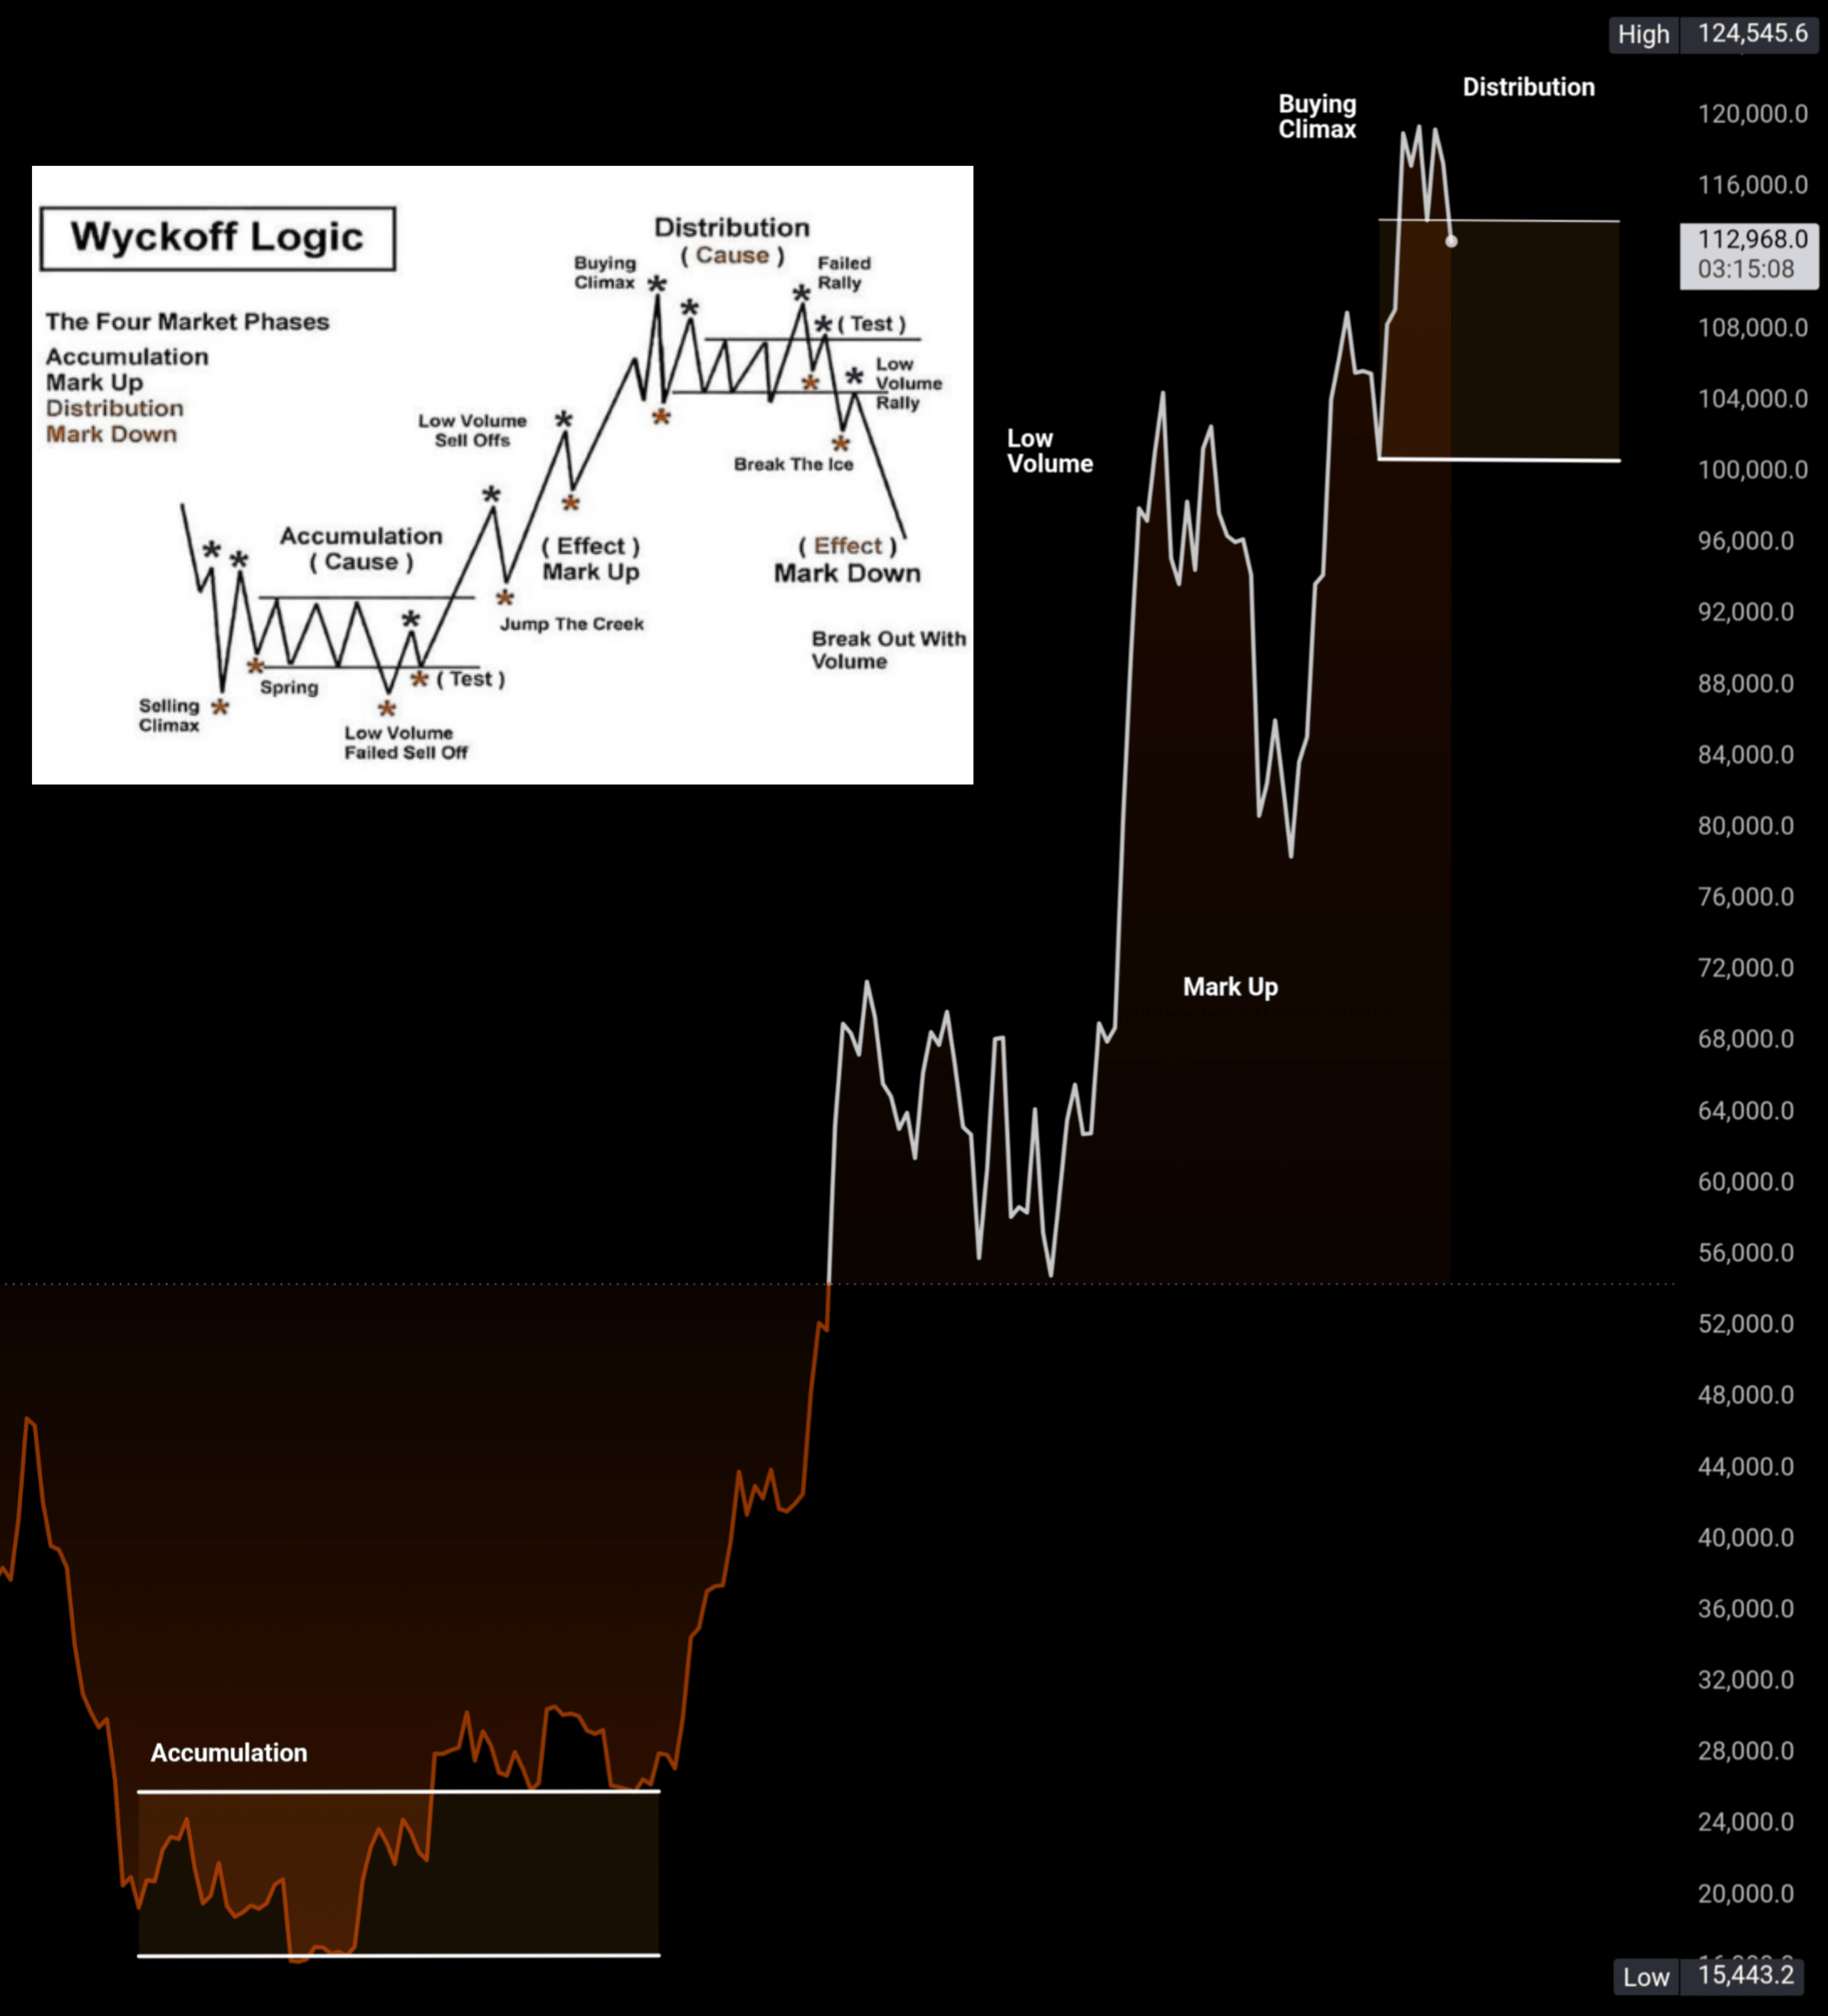
We started from the Accumulation Range to the Selling Climax where liquidity was gathered at low levels in silence.
We then moved to the Markup Phase, which is an impulsive wave that broke resistances and ignited the risk appetite.
Now we are clearly in the Buying Climax within the Distribution range:
We see successive peaks but with decreasing volume (Sign of Weakness).
The market enters a sideways Trading Range where heavy positions are passed to the crowd.
👉 According to Wyckoff: After this phase = Mark Down Phase.
2️⃣ Market Psychology: At the Peak of Euphoria
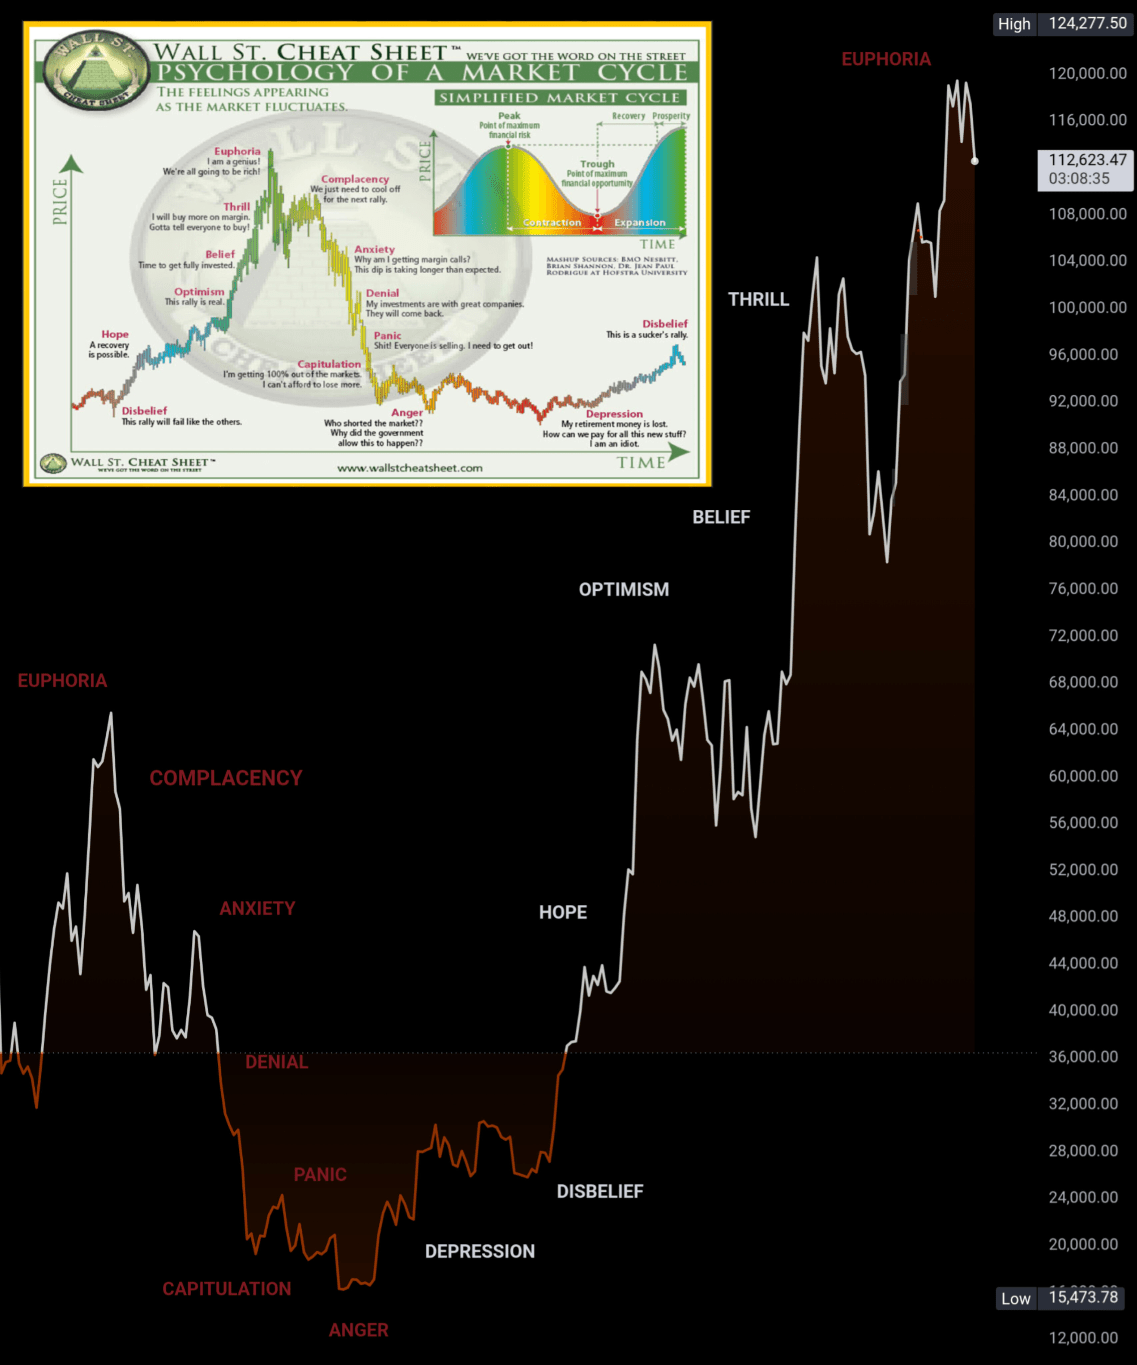
According to the Psychology of a Market Cycle map:
We are in Euphoria – the ultimate emotional high, where phrases like: "The rise will not stop... This time is different" are echoed.
Immediately followed by Complacency – the false reassurance, when the investor thinks that any temporary drop is just a "healthy correction".
Then the cycle begins:
Anxiety → Denial → Panic → Capitulation
This is the psychological and financial liquidation series.
👉 In short: What we are experiencing now is a Bull Trap, where the last liquidity is lured before the drop.
3️⃣ The Parabolic Curve: The Law of Gravity in the Market
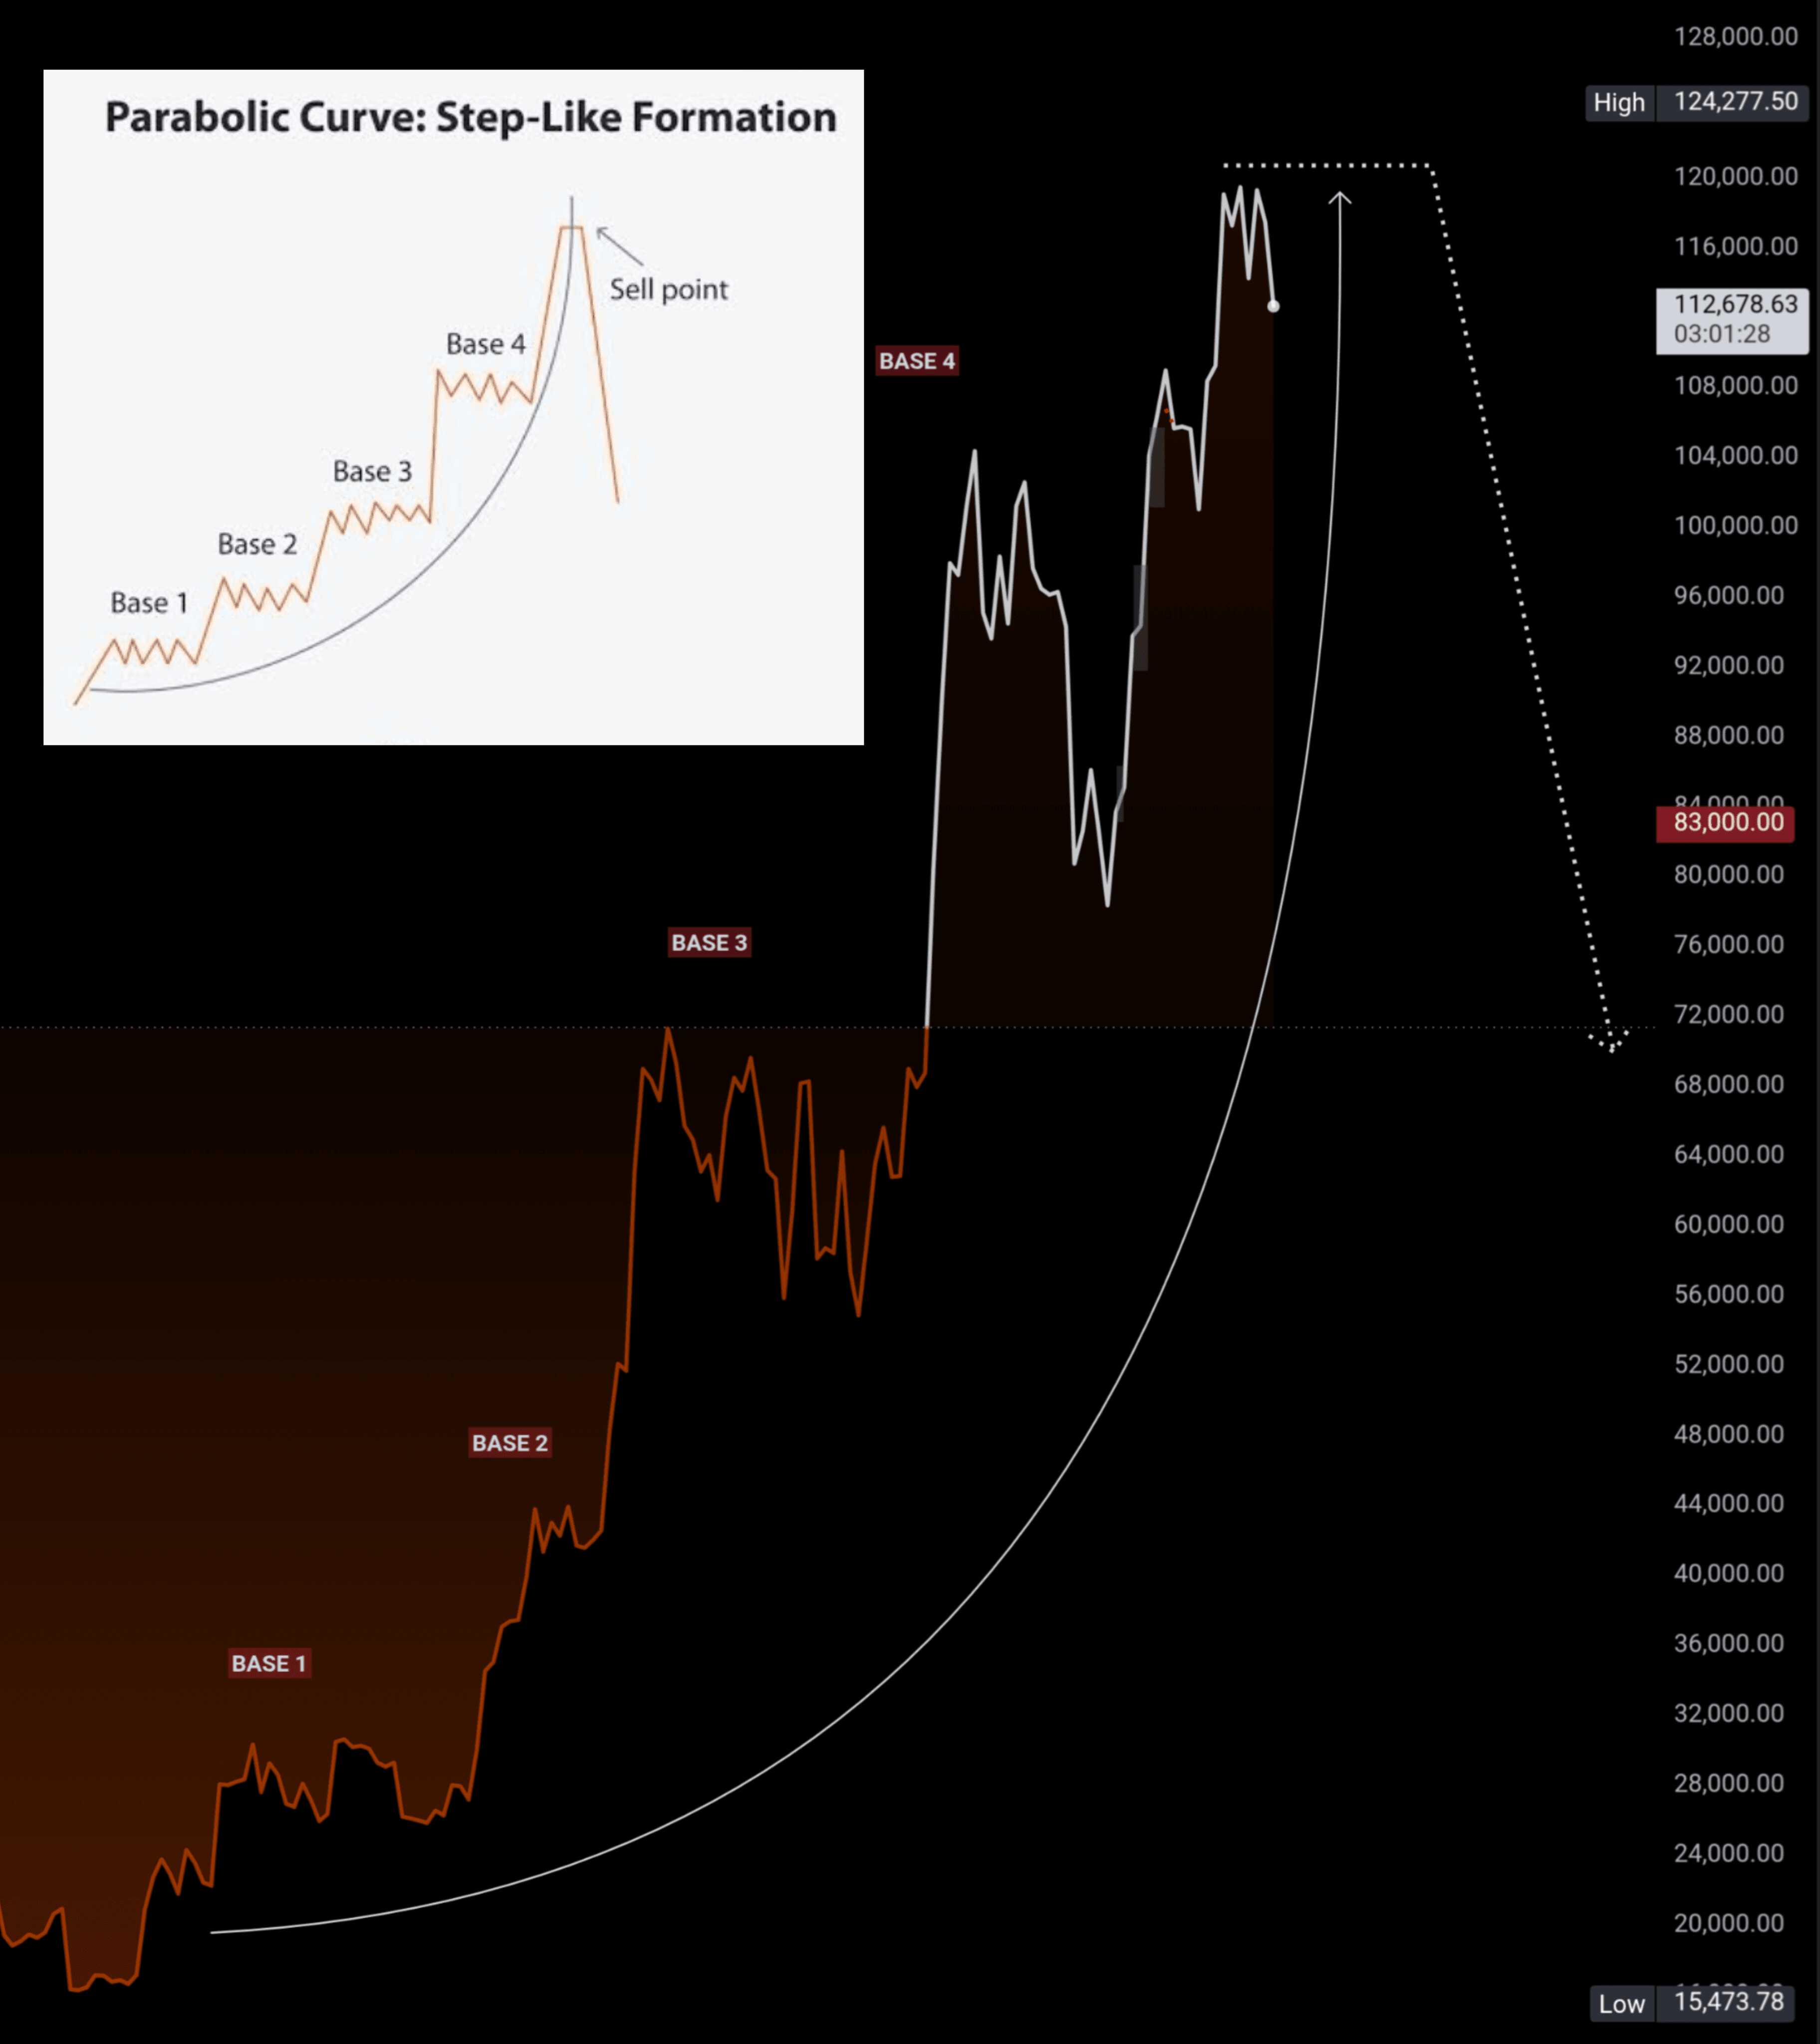
The current rise is a Parabolic Advance with four bases (Base 1 → Base 4).
Base 4 historically is the final peak before the break, where the rise accelerates in an unsustainable manner.
Once the last base is broken, a Parabolic Blow-off occurs, which is a vertical drop often targeting 83,000 – 72,000 as initial rebound zones.
👉 The golden rule: "Everything that has risen parabolically… will fall with the same strength."
4⃣ Gann Square:
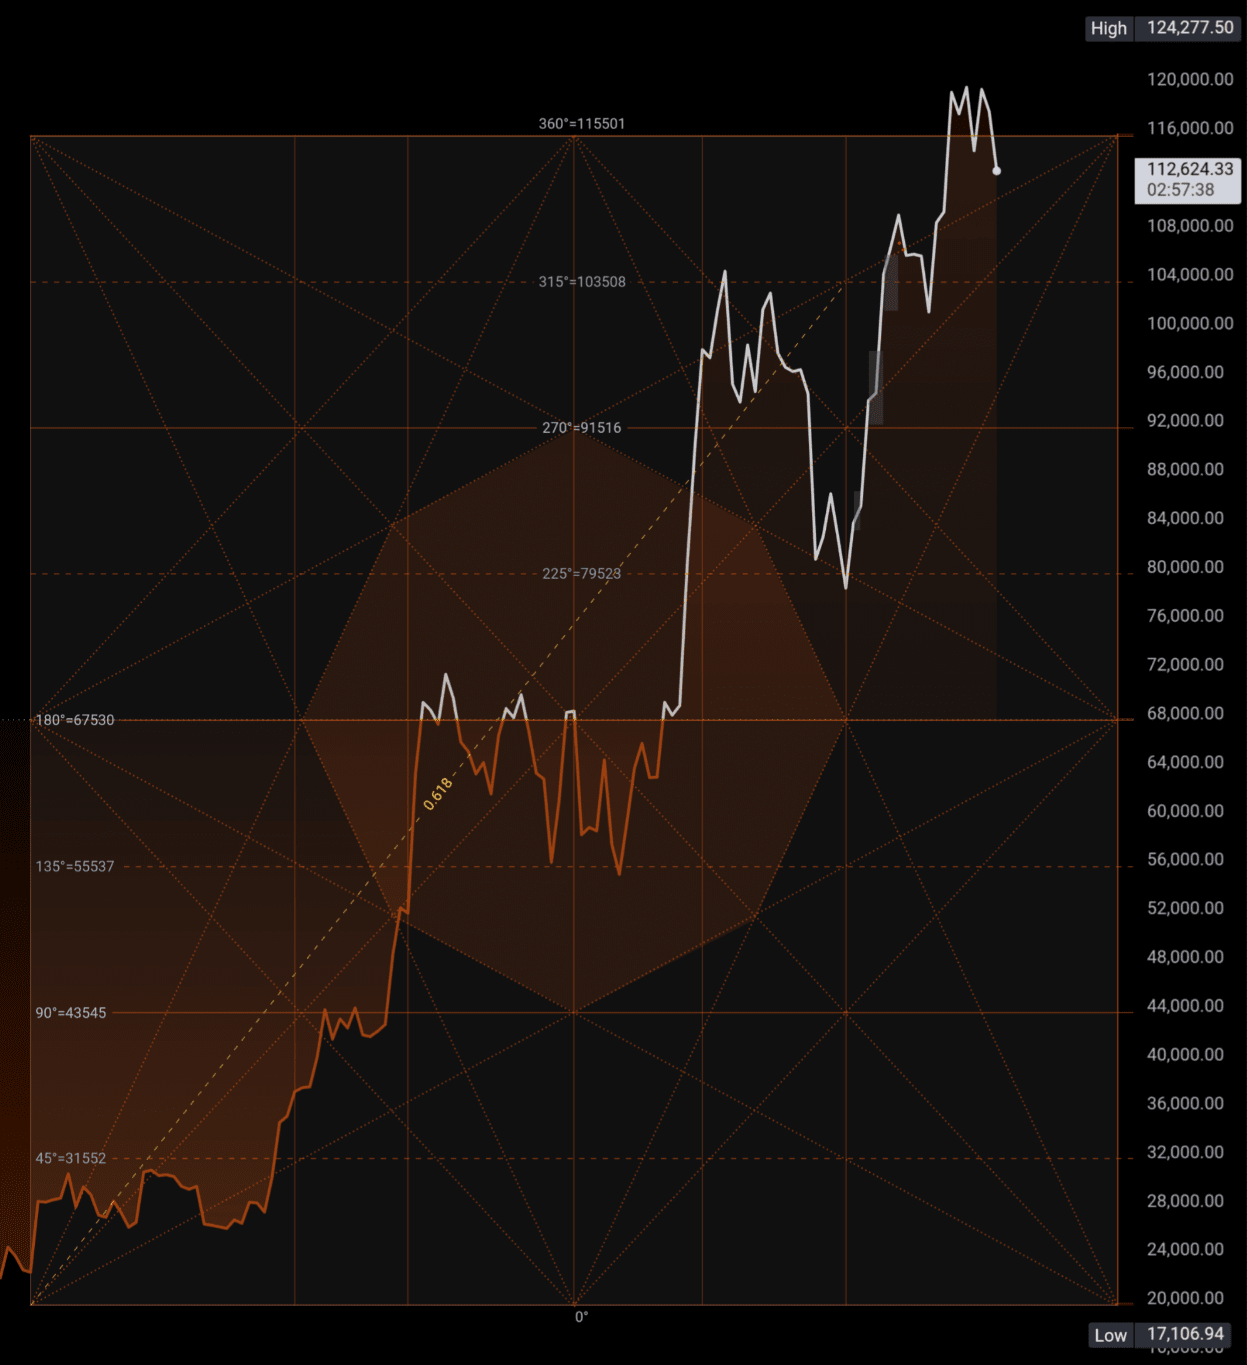
🔥 Gann Square... One glance is enough to see how the price obeyed its movement in terms of price and time.
Look back to previous analyses like this… at levels of 20,000 we were among the first to anticipate the movement accurately, in terms of price and time.
Today Gann tells us the "easy but not obvious":
The price target has been achieved.
What remains is the time factor.
As we approach the end of the cycle, we are nearing the decisive phase.
🔜 Soon I will present a detailed analysis of the Gann Square cycle, but as a strategic hint:
👁️ Watch the support at 67,000… The market will return to visit it in 2026.
🎯 Our current position and what’s next?
Location: We are between the Buying Climax and the Euphoria Trap.
What we have traversed: We completed the accumulation phase + the launch + the liquidity surge… and now we are in the distribution phase.
The next scenario:
Continuation of volatility near the peaks to catch the latecomers.
Beginning of a gradual collapse that turns into a descending parabolic acceleration.
Testing levels 106k → 95k → 73k as pivotal supports.
⚡️ Alert for investors
Smart Money has started to lighten its positions, while Dumb Money enters at full capacity.
This is not a "wealth generation" phase, but a "risk management and tactical withdrawal" phase.
History repeats itself: After the peak always comes a blood bath correction.
📝 The market today stands at the edge between distribution and parabolic euphoria.
Anyone who reads the full picture understands that what is coming is not a continuation of the rise but a major distribution phase followed by a painful drop.
And the professional is one who anticipates the collapse, not one who gets stuck in it.
✍️ And I remind the reader that everything said here is based on the weekly frame, and everything you see now is a reflection of analyses and charts I published years ago, which proved their accuracy by achieving remarkable results.
🔜 Soon I will share with you a detailed reading on the daily frame where we have a visit to $127,400, to complete the picture between the strategic view (Weekly) and the operational vision (Daily).
#BNBATH900 #HEMIBinanceTGE #FamilyOfficeCrypto #CryptoRally #AKEBinanceTGE