based on materials from the site - By Thecoinrepublic.com

The price of Chainlink stood out against the rest of the market. While most tokens struggled, LINK rose over 5% in the last 24 hours. In fact, over the past year, it has risen more than 130%, and over the past week - about 7%. Even when Bitcoin and Ethereum remained flat, Chainlink remained strong.
This made many traders wonder: can Chainlink rise? On-chain and technical charts suggest that it is possible, but not without the help of derivatives.
Chaikin Money Flow (CMF) was used to track real purchases and sales in the spot markets. As of August 20, CMF fell below 0. This indicated that traders' money was not flowing into LINK as actively as before.
Moreover, it formed lower highs. This indicated that each bounce was accompanied by a decrease in purchasing power.
But the dynamics of the indicators were different.
The Money Flow Index (MFI) showed the opposite. Despite the weakening CMF, MFI reached a higher high. This indicated an increase in trading volume at higher prices, which was a signal that traders continued to buy.
The MFI value approached 75. This level is important. Exceeding 75 would mean strong control by buyers. But even without it, MFI indicated market strength.
In short, the strength of the spot market looked shaky, but speculative demand was still noticeable, all thanks to MFI.
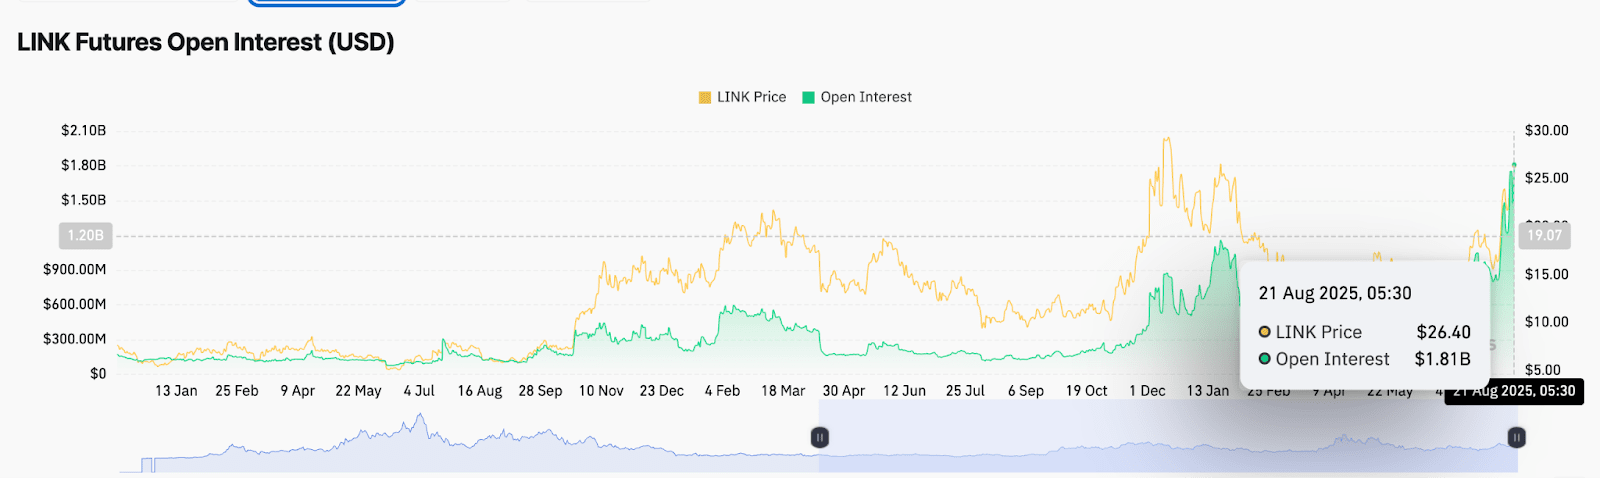
At the same time, open interest also increased. On August 21, it reached $1.81 billion. Just two days earlier, on August 19, it was $1.75 billion. This increase proved that more traders had entered the futures markets.
This also confirmed that the LINK rally was driven not by spot purchases, but by long positions of derivative traders.
When this happens, price jumps can occur quickly. Short selling and high leverage can push prices up, even if real demand is weak. That’s why many rallies in the cryptocurrency market appear sudden; they are often driven by futures rather than real demand.
At the time of publication, LINK was trading around $25.89. Based on Fibonacci levels constructed from previous price movements, the first target was $27.41. The second was $29.92. These were short-term targets. If LINK managed to break above $30, the next possible level would be $34.
This would imply a growth potential of 31% from current levels.
At this moment, LINK shows good strength. It confidently rebounded from the $23.36 mark and managed to break above $25. This breakout was accompanied by high demand for long positions, activity on weak positions, and growing excitement on social media.
Well-known traders would also take a bullish stance. Ash Crypto reported that LINK is breaking a multi-year trend against Bitcoin. According to the chart they presented, Chainlink may be preparing for a long-term breakout.
In another report, it was mentioned that many global banks and companies started using Chainlink's services. Among them are BNP Paribas, Citi, ICE, Clearstream, and others. This indicated that Chainlink is gaining popularity in the real world, which is a key factor in investor confidence.
This did not mean that prices would rise forever, but it indicated growing confidence.
The price of Chainlink demonstrated strength that few altcoins could match. CMF was weak, but MFI and derivatives said otherwise. Traders increased their futures positions, hoping for a rise above $30. If the momentum continues, the next could be $34.
$BTC, $XRP, $BNB
#Cryptomarketnews, #TrumpTariffs
Here, in one news feed, we collect and publish the latest news from more than a dozen news sites and print publications, and sometimes simply share our observations on market trends. As well as news related to changes in the cryptocurrency market and global financial changes!!!
Welcome to us! There are enough news for everyone!!! 😉


