A trick for beginners: How to read Binance charts quickly (one hour)
Binance charts may seem confusing for beginners at first, especially with green and red candles, strange lines, and numerous figures. But with a few simple tricks, you can start reading a one-hour chart confidently in just a few minutes.
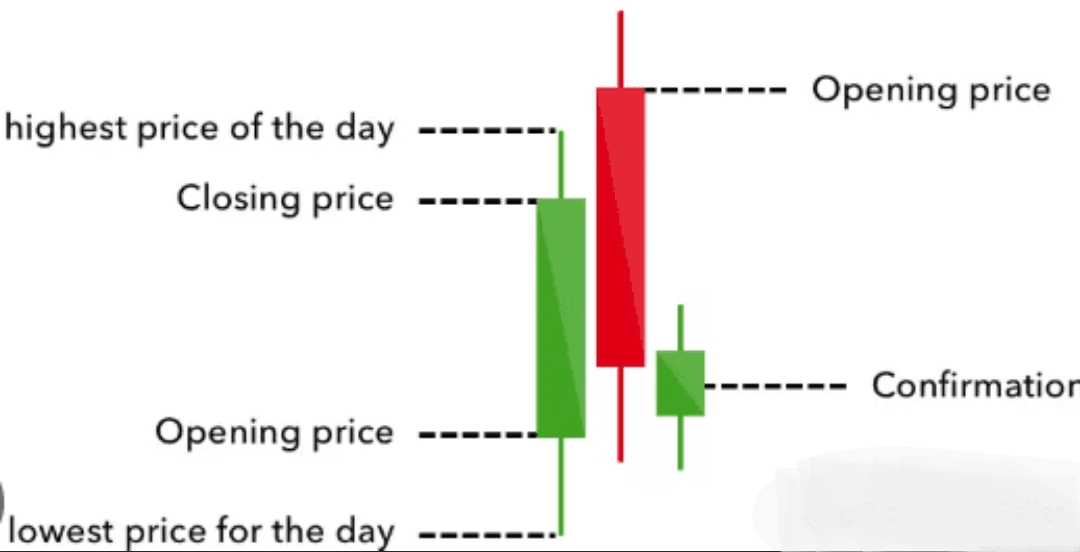
Understanding candles
Green candle → price increased during that hour.
Red candle → price decreased during that hour.
Wicks (thin lines) → highest and lowest price reached during that hour.
Pro tip: Long wicks indicate strong rejection at those levels (buyers or sellers push the price back).
Identifying support and resistance
Support = the "floor" price where buyers enter.
Resistance = the "ceiling" price where sellers appear.
If the price breaks above the resistance level, it may rise further. If it breaks below the support level, it may drop.
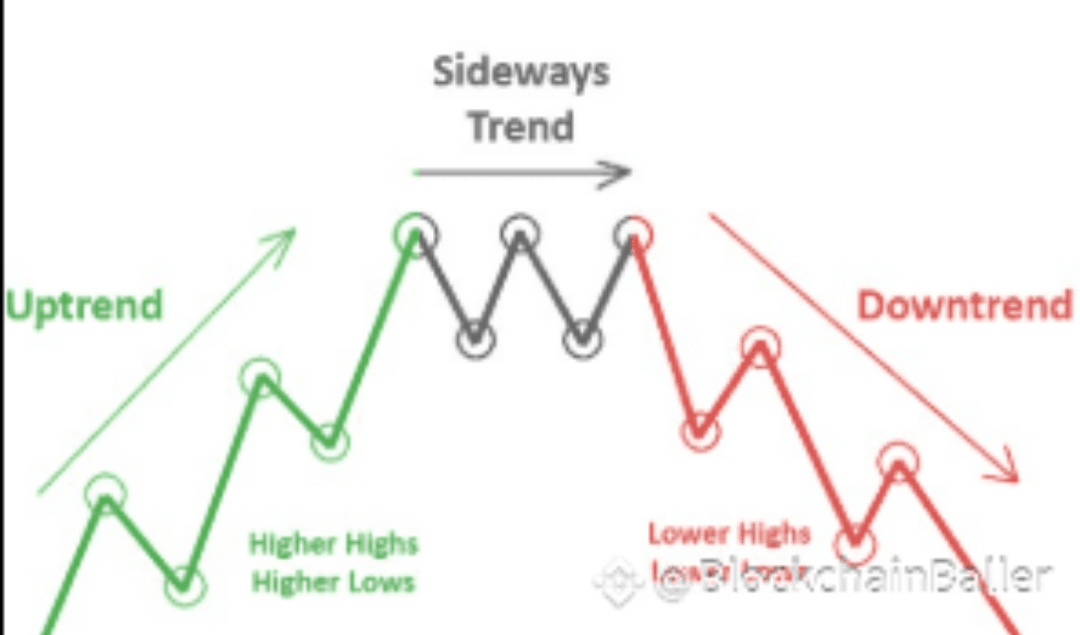
Reading the trend
Uptrend → higher highs and higher lows. Downtrend → lower highs and lower lows.
Sideways trend → the market moves steadily, with no clear direction.
Tip: Always trade with the trend, not against it.
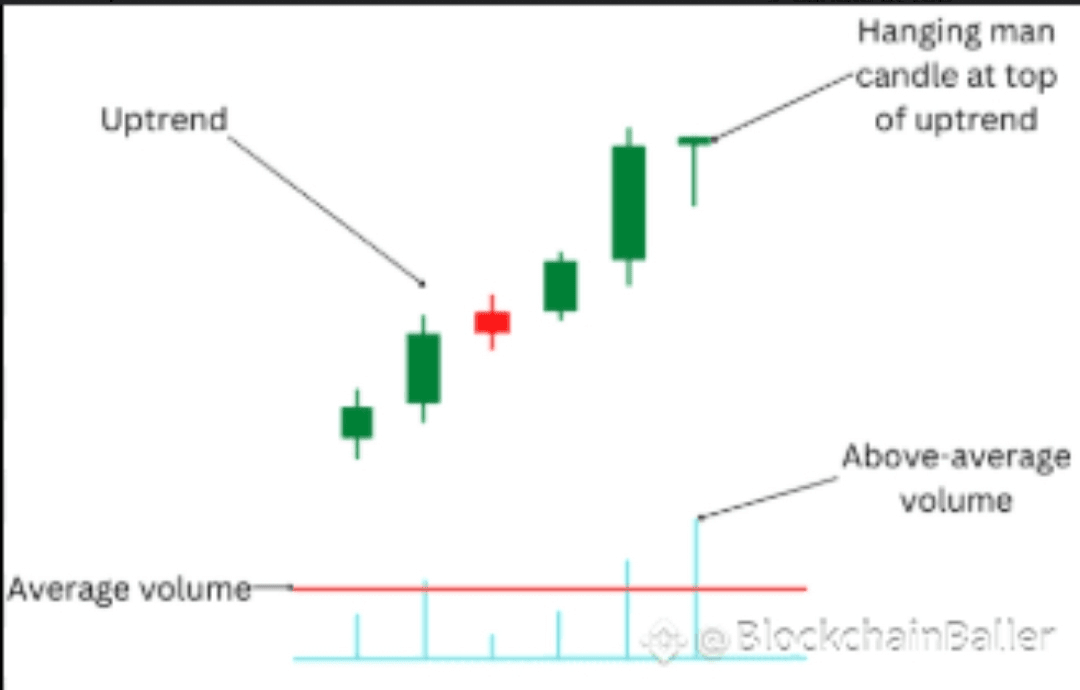
Checking trading volume
High trading volume = strong movements supported by traders.
Low trading volume = weak movements or stability.
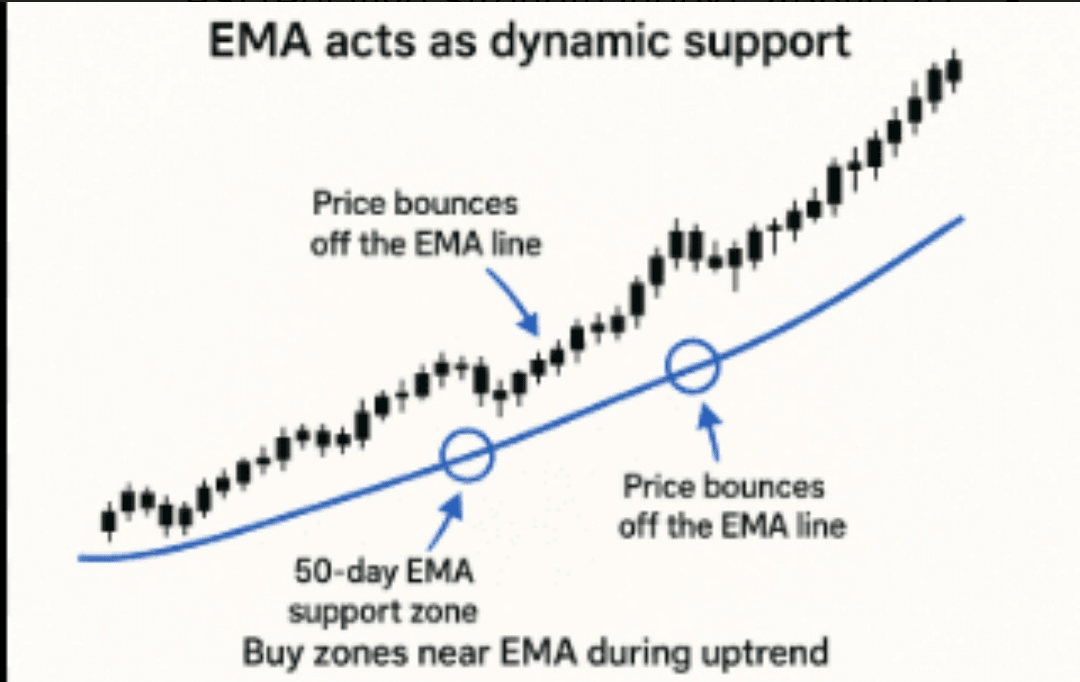
How to read indicators
Indicators are tools that help confirm price direction.
Moving Averages (MA/EMA): If the price remains above the moving average line, it indicates strength; if it remains below, it indicates weakness.
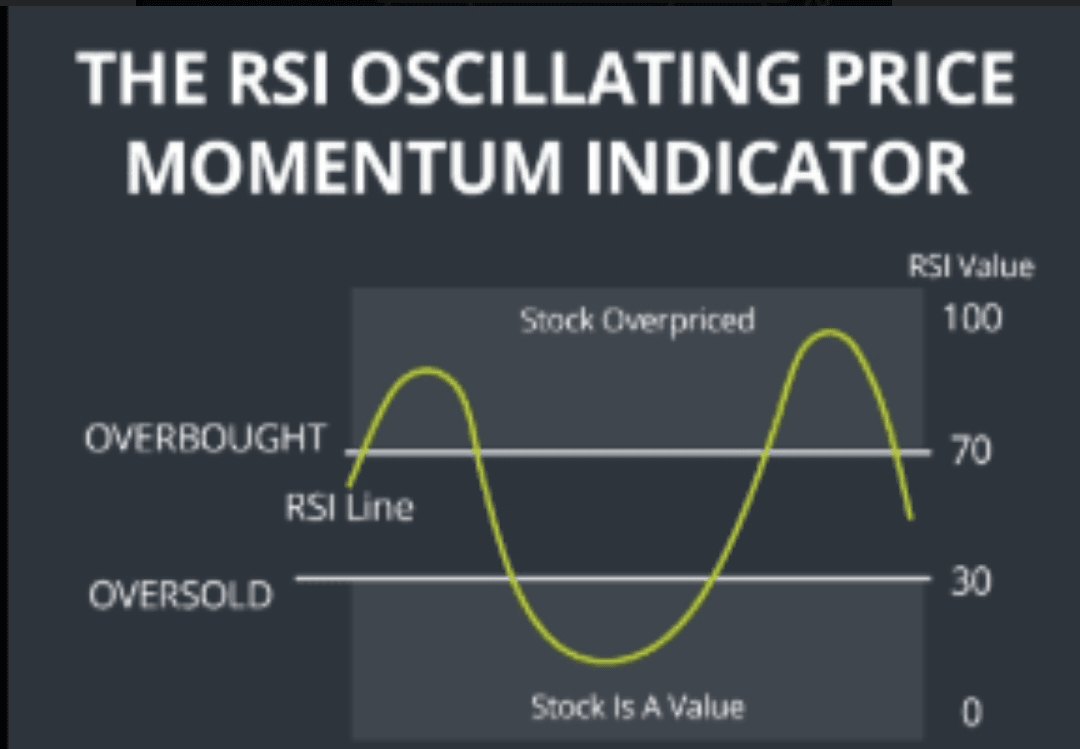
Relative Strength Index (RSI): Above 70 = potential overbought (price may cool off), below 30 = oversold (price may bounce back).
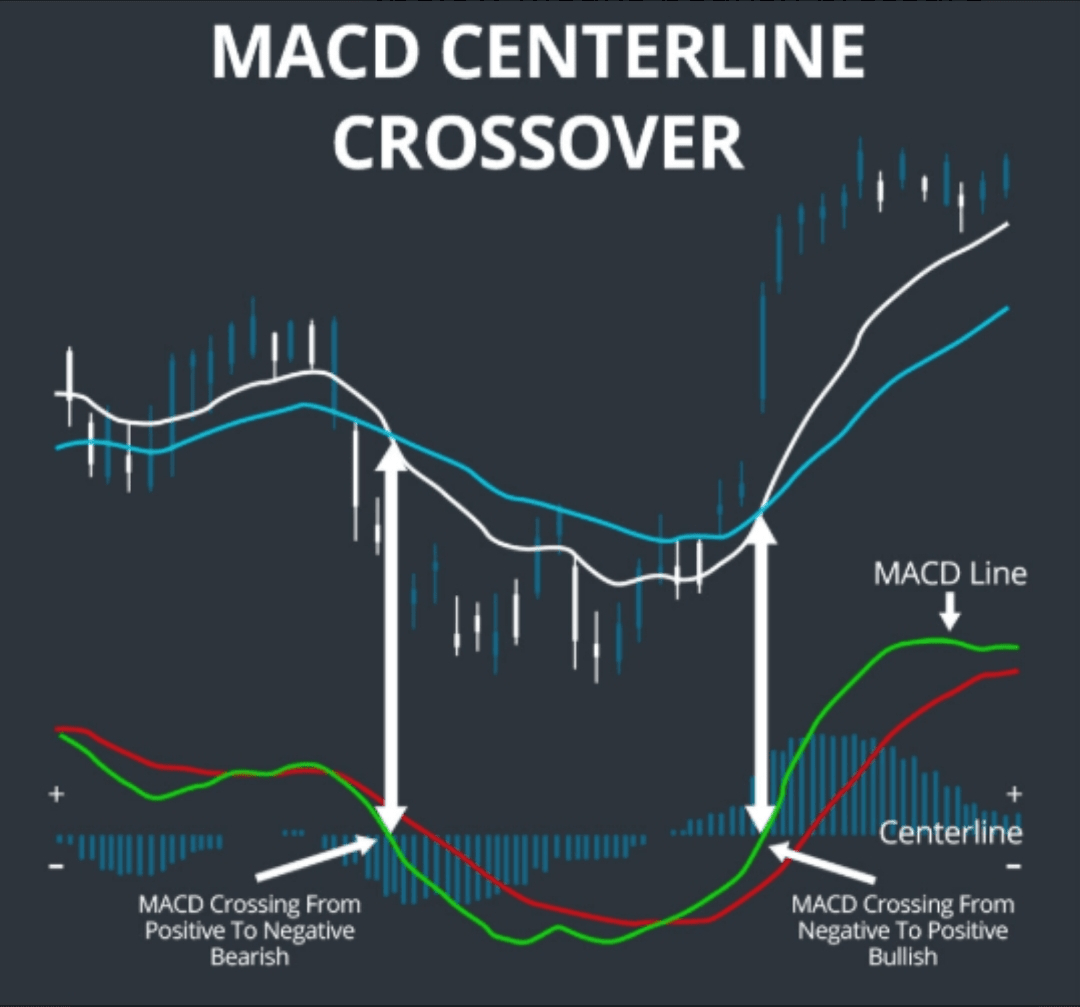
MACD Indicator: When the fast line crosses above the slow moving average line, it indicates bullish momentum; if it crosses below, it indicates bearish pressure.
Consider indicators as "aids," not "crystal balls." Always use them in conjunction with candlestick patterns, support/resistance indicators, and trading volume indicators. Quick summary:
In 5 minutes, you can read a one-hour chart by focusing on:
1. Candlestick patterns (price movement)
2. Support and resistance levels
3. Trend direction
4. Strength of trading volume
5. Indicators as confirmation
Conclusion
Learning to read Binance charts is not difficult. By focusing on time frames, candlestick patterns, and key indicators, beginners can quickly spot market trends and make smarter trading decisions. With practice, what may seem confusing today will soon feel natural, turning every chart into a valuable tool for building confidence and consistency in trading.
With practice, you will move from guessing to making smart, informed trades.