Author: Shen Ge Talks Trends #ETH创历史新高 #ETH走势分析
As a senior blogger in the crypto circle, Shen Ge immerses himself every day in the ever-changing market, closely monitoring price trends, trying to capture every valuable signal. Today, we will conduct an in-depth analysis of the ETH 4-hour trend.
1. Key Data Interpretation
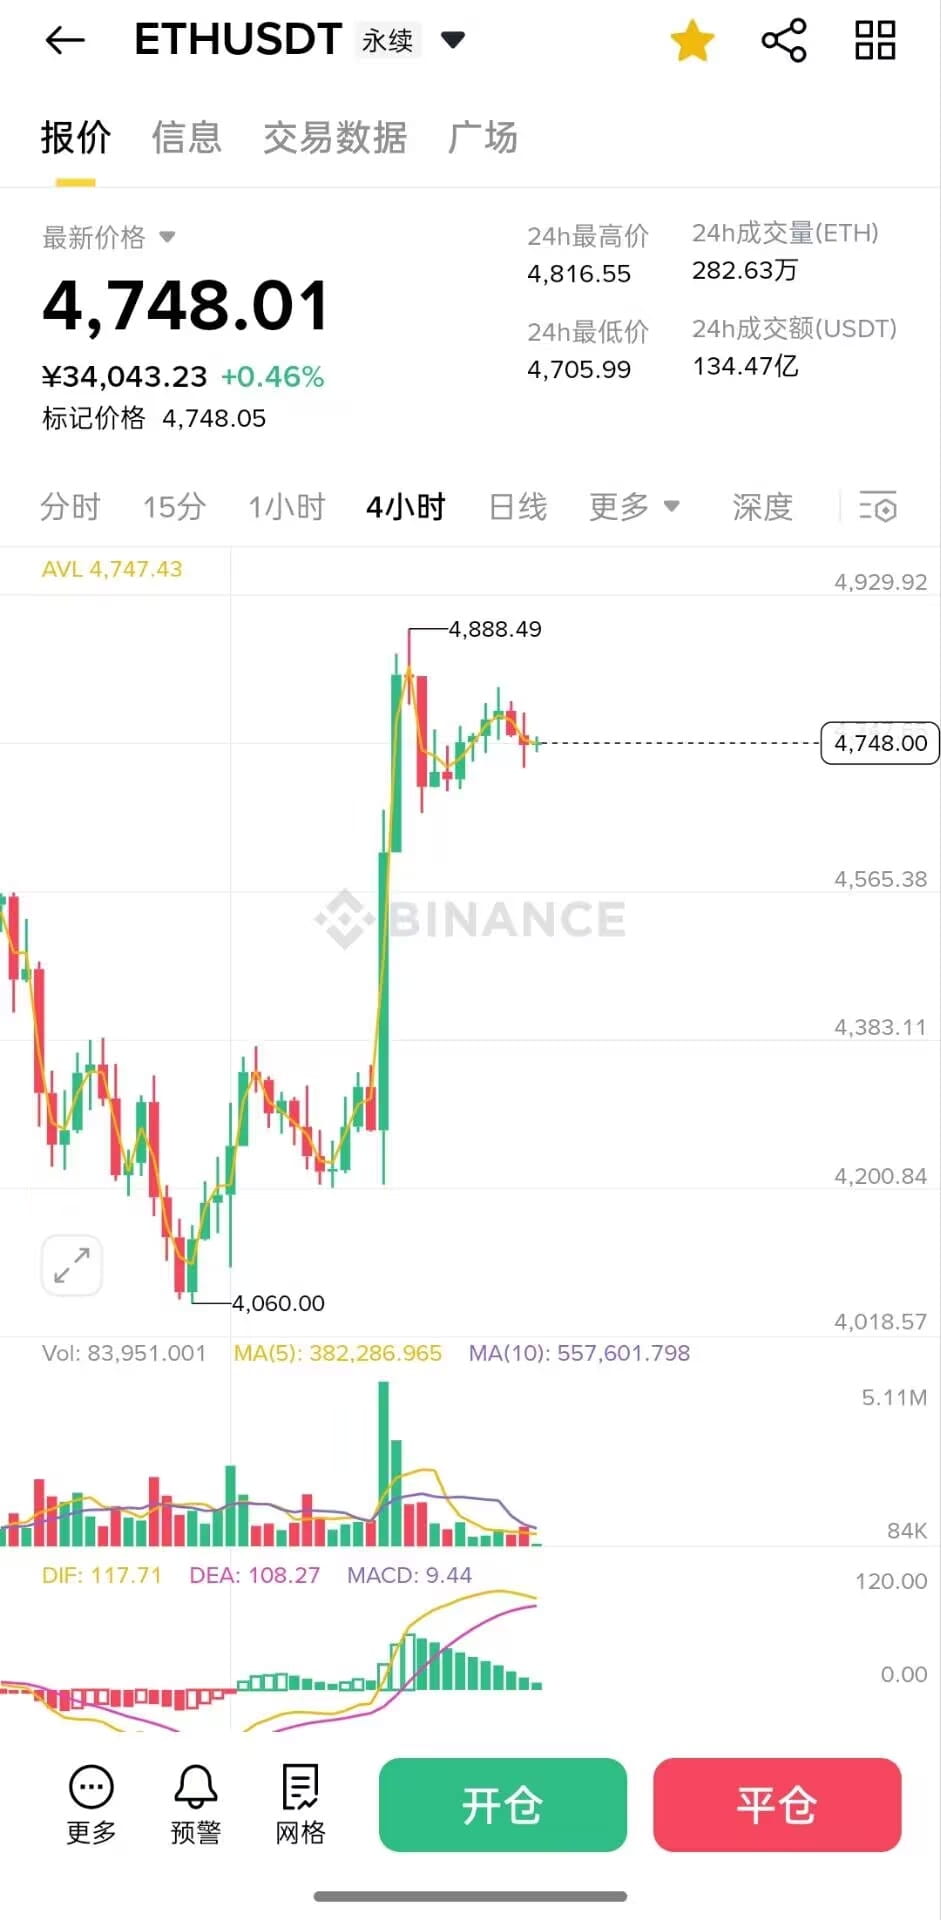
From the current data, the latest price of the ETH/USDT perpetual contract is $4,748.01, equivalent to approximately ¥34,043.23, with an increase of 0.46% compared to before. The marked price is $4,748.05. In the past 24 hours, the price has fluctuated significantly, reaching a high of $4,816.55 and a low of $4,705.99. In terms of trading volume, the 24-hour ETH trading volume is 2.8263 million, and the USDT trading volume is 13.47 billion, indicating a high level of market activity with intense competition between bulls and bears.
2. K-line Trend Analysis
Observing the 4-hour K-line chart, we can find that the ETH price trend presents a relatively complex shape. Earlier, the price experienced a rapid surge, once reaching $4,888.49, then began to fall and consolidate. From the K-line combination, after the surge, a series of long upper shadow K-lines appeared, indicating that there is a certain selling pressure above.
Currently, the price is temporarily stabilizing around $4,748. From the arrangement of K-lines, there has not been a clear single-sided downward or upward trend, but rather a state of consolidation. This oscillation indicates that both bulls and bears have temporarily reached a balance near the current price level, both waiting for a new catalyst to break this balance.
3. Technical Indicator Analysis
(1) AVL Indicator
The AVL (Average Price Line) is $4,747.43, which is very close to the current price. This means that within the 4-hour cycle, the price fluctuates around the average cost price, indicating that the market is in a relatively balanced state, with neither side holding an absolute advantage.
(2) Moving Average System
MA(5) is 382,286.965, MA(10) is 557,601.798, and the short-term moving average is entangled with the medium-term moving average. This moving average shape usually reflects an unclear market trend, indicating that the price direction is difficult to determine quickly in the short term, and it may maintain a period of oscillation.
(3) MACD Indicator
The DIF value is 117.71, the DEA value is 108.27, and the MACD histogram is 9.44. Currently, the MACD indicator is still above the zero axis, indicating that the bullish force still holds a certain advantage overall. However, the red histogram is gradually shortening, indicating that the bullish force is gradually weakening. If the subsequent red histogram turns into a green histogram, it may mean that the bearish force begins to take the upper hand, posing a risk of further price correction.
4. Next Steps
(1) For holders
1. For long position holders: Although the current price is in a state of oscillation, it is still relatively high overall. You can closely monitor the support range of $4,700 - $4,720. If the price breaks below this range, and if the K-line shape shows a clear downward signal (such as a long bearish line), you should consider reducing positions to control risk. The upper resistance level can be monitored at $4,800 - $4,820; if it can be broken through with increased volume and the MACD and other indicators perform well, then you can continue to hold long positions or even add to your position for further gains.
2. For short position holders: Given that the current bullish force in the market has not completely dissipated, and that there are signs of stabilization near the support level, those holding short positions should remain cautious. Stop-loss can be set around $4,760 - $4,780. If the price breaks above the stop-loss level, exit in a timely manner. At the same time, pay attention to the integer level of $4,700 below; if the price effectively breaks below this level, you can consider holding short positions to wait for further downward space.
(2) For non-enterers
In the current unclear ETH 4-hour trend, it is recommended to observe temporarily and wait for the market to provide clearer signals. Focus on whether the price can effectively break through the upper resistance level or the lower support level, as well as changes in trading volume. When the price breaks through the resistance level with a significant increase in trading volume, or breaks below the support level with a release of market panic, consider entry operations.
In summary, the crypto market is full of uncertainty, and the 4-hour trend is merely a short-term reference. We need to combine trends from more time periods, market news, and other factors for a comprehensive analysis to make more reasonable investment decisions. At the same time, it is crucial to strictly control risks, manage positions well, and ensure steady progress in this market full of opportunities and challenges.
Note: If you want to delve deep into the crypto circle but can't find direction, and want to quickly get started and understand the information gap, click on the avatar to follow me, and check out the blogger's profile. Gain firsthand information and in-depth analysis!)
