
EGRAG CRYPTO, a well-known market analyst, believes that the charts are very clear and he has predicted a very specific price level. According to him, there is a threshold indicating whether Ripple's XRP is still on track or about to lose momentum. This is not about wild guessing or overhyping. It’s about reading the signals that the chart is quietly presenting.
Ripple and the XRP token have had a tumultuous year. The price of XRP soared to highs, then dropped, and is currently trading around $3. Just that alone is enough to attract attention. However, what makes this moment even more exciting is what is happening behind the scenes.
EGRAG CRYPTO has posted a new update that clarifies things further. He points out that $2.73 is not just a line on the chart. He refers to it as a macro support level. This means that if the price of XRP stays above $2.73, the overall trend remains intact. When XRP dropped to this area earlier this year, buyers stepped in and the price bounced back. That is why he believes $2.73 is a level to watch closely.
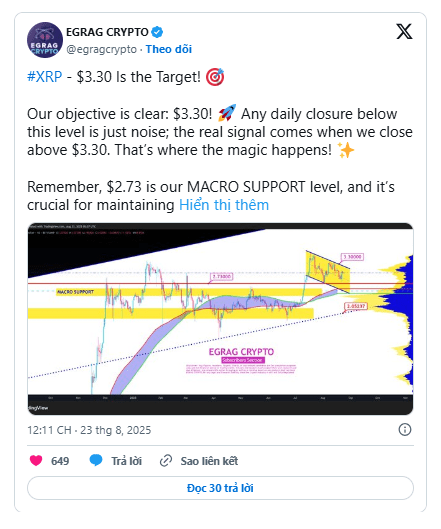
He also said that $3.30 is the main target. According to him, "Our goal is very clear: $3.30. Any daily close below this level is just noise. The real signal will appear when the price closes above $3.30." In other words, that is the price level that could confirm XRP is ready for the next big move.
What Does the Ripple Chart Really Show?
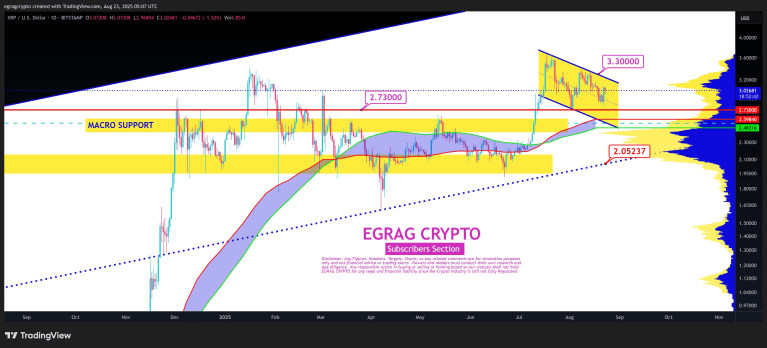
When looking at EGRAG CRYPTO's chart, you will see a few important zones. The most obvious zone is the yellow macro support band located around the $2.48 to $2.73 range. This area has repeatedly acted as a buffer for the price of XRP. It's like a safety net for a tightrope walker - you don't want to fall.
There is also a downward sloping yellow channel near the top right corner. This is a classic flag pattern. Simply put, it shows that the price is taking a breather after a strong rally. Imagine it like an athlete catching their breath before a final sprint. This channel leads directly to the $3.30 area — a level that EGRAG says is the "magical" zone.
Another noteworthy point is the blue volume chart on the right side of the chart. The large blue line around the $2.50 level indicates that the price of XRP has been bought and sold a lot in the past. This price level often acts as a magnet or a shield. If the price drops to that range again, it could attract strong buying pressure.
EGRAG CRYPTO also notes another safety threshold at $2.05. This level is where the long-term trend line and historical support band meet. If things do not unfold as expected, this will be the last bastion.
EGRAG's tone is calm yet focused. He advises followers not to be distracted by any small red candles. In his view, the market is rife with fluctuations. Prices change every day, but the bigger picture is what matters more. That is why he always says: "Stay steady and strong."
