

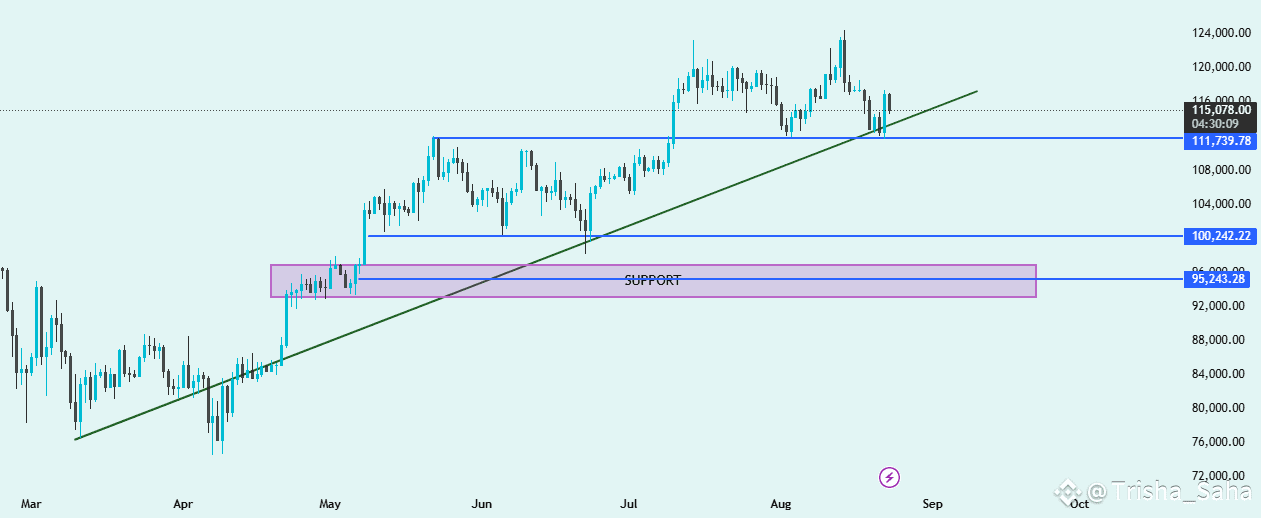
🔹 Trend Structure
Price is currently trading above the trendline, suggesting bulls are still in control, but momentum has weakened.
🔹 Support Zones
Immediate Support: 🔵 $111,739
Price recently tested this level and bounced, showing demand from buyers.
Key Mid-Support: 🔵 $100,242
Strong historical level where buyers stepped in multiple times.
Major Demand Zone: 🟪 $95,243 – $96,500
Highlighted purple support box; this is a critical accumulation zone where bulls are likely to defend strongly.
🔹 Resistance Levels
Near-term resistance: Around $120,000 – $124,000 (recent swing highs).
A breakout above this zone could fuel a new bullish rally.
🔹 Market Outlook
✅ Bullish Bias as long as price respects the green trendline and stays above $111,739.
⚠️ If the price breaks below $111,739 and the trendline, expect a deeper pullback toward $100,242 or even the major demand zone $95,243.
🚀 A breakout above $120K will signal strong continuation to new highs.
📌 Summary:
Trend: Uptrend ✅
Key Supports: $111,739 → $100,242 → $95,243
Resistance: $120,000 – $124,000
Bias: Bullish above $111K, cautious below 🔻