Today, I want to take on the role of a 'dog-fighting blogger' to help my brothers see the table and look at what those 'opponents' hidden behind the K-lines really look like.
In the MEME coin casino, you don't even know who your opponent is.
Brothers, let me ask a heart-wrenching question first:
Have you ever experienced a coin you were optimistic about, feeling that the fundamentals and community enthusiasm were in place, and you really invested real money? But just as the K-line began to rise, a big bearish line directly pierced the core, and you were buried without knowing who was dumping?
Or, you see a new coin launched, the pool is locked, and the permissions are lost, looking like a 'conscientious project'. But after a few days, the price just won't go up, and there are continuous sell orders every day that wear down your patience. Eventually, you cut your losses and leave, and then it starts to pump.
Isn't it familiar?
We retail investors are like sitting at an open poker table, where every card we hold (holdings, transaction records) is clearly recorded on-chain. Meanwhile, our opponents—the project parties, whales, VCs, insider traders...—are hiding in the dark, quietly transferring chips and conspiring to dump in ways we cannot understand.
The information is extremely asymmetric, and this is the root of our losses.
I've been looking for a tool that can reveal my opponent's cards, even if it's just lifting a corner. It's not about looking at K-lines or technical indicators, but directly looking at the 'relationships between holding addresses'.
Until I discovered Bubblemaps.

Bubblemaps: It's not a telescope, but a 'demon-revealing mirror'
The first time I opened Bubblemaps, I was a bit shocked.
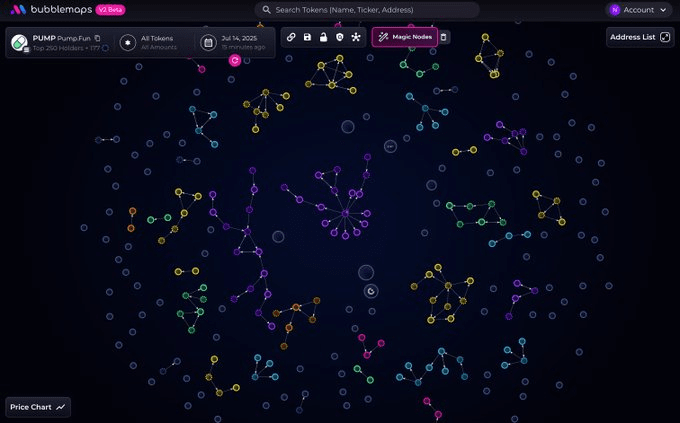
What it does is actually very simple but hits the nail on the head: it presents all holding addresses of a token through a visual 'bubble chart'.
The bigger the bubble, the more holdings it represents.
Bubbles connected by lines represent a transfer relationship between these addresses.
With just these two simple logics, what tricks can you play? Let me show you what a few typical 'monsters' look like.
Scenario one: Insider trading exposed
You input a newly launched MEME coin contract address, and when the map comes out, you see a large bubble (possibly the project's deployment wallet) closely connected with dozens of medium-sized bubbles. These small bubbles received tokens from this large bubble in a very short time before the token launched.
What does this mean?
This is most likely the project party's insider trading or early investors. These addresses have extremely low costs and are the future's most unstable selling pressure source. When the K-line rises and retail investors FOMO in, any one of these bubbles cashing out will trigger a chain reaction. With Bubblemaps, you can see clearly how many 'Sword of Damocles' are hanging over your head before you rush in.
Scenario two: VC/institution distribution network
You analyze a well-known value coin and find a huge bubble (VC or early fund) connected to a bunch of medium-sized bubbles. And these medium bubbles each connect to even more small bubbles.
What does this indicate?
This is likely institutions distributing their chips, giving tokens to different market makers, partners, or sub-wallets. This structure may not necessarily indicate an immediate dump, but it reveals the concentration of chips and the potential for coordinated actions. If these associated wallets transfer coins to exchanges at the same time, you need to be extra cautious.
Scenario three: 'Contaminated' airdrop
When a project issues an airdrop, you notice several super large bubbles appear on the map, connected to hundreds or thousands of small bubbles with almost no other trading records. After these small bubbles receive the airdrop, they quickly consolidate the tokens into those large bubbles.
Even a fool can see this is a witch attack.
Airdrops were heavily exploited by a small number of people. You can not only see how badly this project was exploited, but also judge whether these 'scientists' will create huge selling pressure in the secondary market.
When fighting dogs, you also need to talk about 'human perception'
At this point, I must emphasize one thing:
Bubblemaps is not a crystal ball predicting rises and falls; it can't tell you if this coin will rise or fall tomorrow. It's a tool to improve your 'survival rate'.
In the dark forest of Web3, surviving is more important than anything else.
Its greatest value is turning a cold, long list of on-chain addresses into a relationship map that you can understand, one that has 'human flavor'. You can almost see the operation tracks and potential intentions of the people behind it.
It is professional enough: Its data comes directly from on-chain, with clear logic and no subjective assumptions. Each connection represents a real transfer.
It has a novel perspective: While everyone is focusing on K-lines and trading volumes, you are examining the entire token's power structure and chip distribution. This is a dimensionality reduction strike.
It's close to the hot spots: Whenever a new MEME coin or popular project comes out, checking it on Bubblemaps has become my muscle memory. It can help you filter out at least 80% of potential traps.
Ultimately, tools are dead, and people are alive. Even if you understand the map, you still need to combine it with the project's specific situation and market sentiment to make a judgment. But at least, Bubblemaps gives us ordinary users a chance, a chance to stand slightly closer to the information level of whales and project parties.
It allows us to see who the 'players' are at the table before we place our bets, and whether they are secretly colluding.
This may be the greatest fairness we can fight for in this cruel market.