After breaking below $3, the price of XRP seems to be entering another triangular formation, which may eventually break out. This formation on the 4-hour chart began in July and could naturally close in the coming weeks, especially as sellers appear to be exhausted at this level.
Support levels for XRP to watch
Anonymous cryptocurrency analyst TheSignalyst points out that as XRP falls into a bearish zone, an interesting formation appears on its price chart. The analyst refers to this as a 'perfect triangle' formation and believes there is a possibility of a breakout at the end of this formation.
First, TheSignalyst emphasizes that the price of XRP has been hovering upward in a typical symmetrical triangle since then. This has also occurred on the 4-hour chart, where both bulls and bears are struggling to defend the next major level.
Bulls continue to strive to hold the support level above $2.78, while the price further declines due to selling pressure. Meanwhile, bears are continuously increasing resistance within the triangle, and the two trend lines may soon cross.
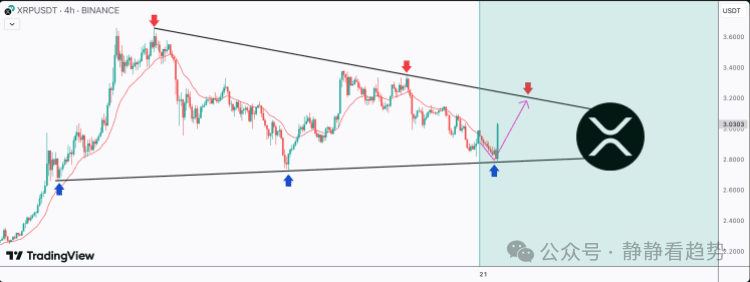
So far, bears seem to have a greater advantage as the price of XRP continues to decline, and this altcoin is currently testing the lower limit of the triangle. As pressure mounts, bulls must hold this lower limit to achieve a rebound. If this level is maintained, analysts say that XRP may see a rebound and eventually approach the upper limit.
If a rebound occurs, the price of XRP could rise by more than 14% and test the $3.2 level again. Bears will reappear at this resistance level, and sellers need to counterattack at this level to invalidate the upward trend.
However, if the downward trend line fails to hold above $2.78 and bears can break below this level, it may signal a continued downward trend. Breaking below this level would invalidate the 'perfect triangle' structure and could push XRP's price back to $2.5, where there is significant buying support.