Trend and Structure Determination
Perspective of Chan Theory
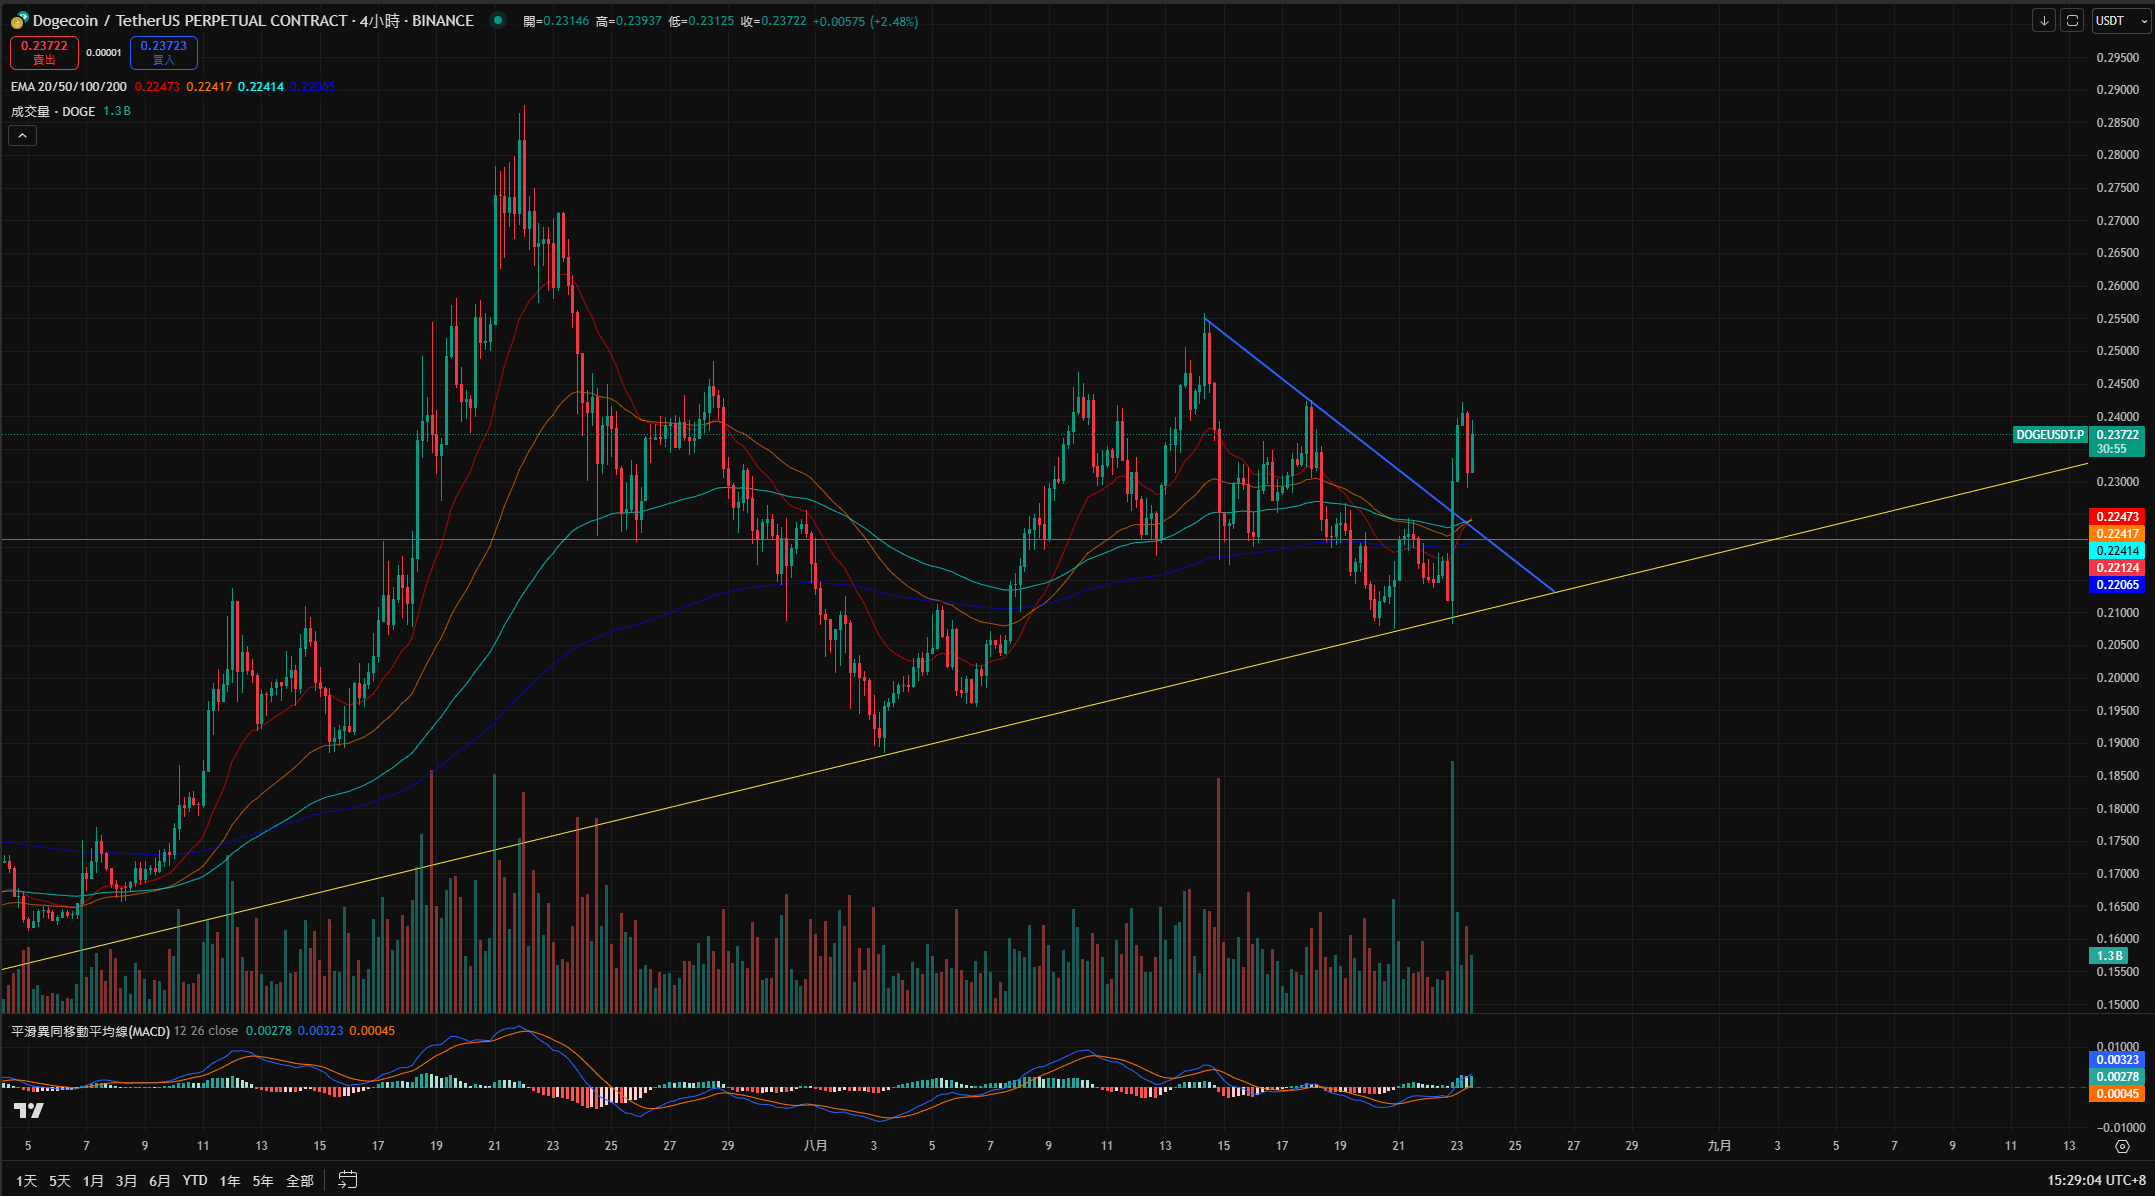
This level shows **continuation structure of the rising trend**: the previous low point relies on the rising trend line (yellow line) to form effective support, and there has been no effective decline central after the pen damage, currently in the construction of a new rising pen, MACD dual lines run above the zero axis, red bars have a release expectation, bullish momentum dominates.
Volume-Price Verification (Similar to Wyckoff Logic)
When the price falls back to the trend line, the volume has shrunk more than 35% compared to the previous wave of decline, indicating **exhaustion of selling pressure**; the rebound accompanied by increased volume (recent red bar trading volume increased), verifies the willingness of the main force to take positions, and the bullish trend foundation is solid.
Multi-Cycle Resonance Signal
✅ Daily: Relying on medium to long-term moving averages (EMA200, etc.) to oscillate upward, currently within the rising trend channel, the current pullback belongs to normal adjustments within the trend.
✅ 4 Hours: The rising trend line (yellow line) support is effective, and the EMA moving average system is arranged in a bullish manner (short-term moving averages turning upward), with strong trend continuation.
✅ 1 Hour: No top divergence signal has appeared, quickly recovering after a small-level pullback, confirming the bullish control power within the day.
## Pullback Long Strategy
### Entry Logic
Using rising trend line support + the expectation of continuation of Chan theory rising pen, pullback to **trend line (yellow line) + key moving average (near EMA50, around 0.221 area)** is a buying point for going long, fitting the 'trend continuation + pullback confirmation' trading model.
### Specific Operations
1️⃣ **Entry Range**: 0.221 - 0.223 (support area of trend line and EMA50 resonance)
2️⃣ **Stop Loss Setting**: If it breaks below the trend line and closes below it on the 1-hour chart, stop loss at 0.219 (previous low support, strictly control risk)
3️⃣ **Target Price**:
- Short-term: 0.232 (previous high resistance, breaking it opens up space)
- Medium-term: 0.245 (upper edge of the daily rising channel)
4️⃣ **Position Management**:
- First position 50%: directly enter the support area on pullback, betting on trend continuation.
- Breakout additional position 30%: price breaks 0.228 (small level resistance), adding positions to expand profits.
- Reserve 20%: to prevent extreme pullbacks, if the trend line support is effective, a secondary position can be added.
Dynamic Risk Control and Signals
▶️ **Key Defense Line**: Bullish defense position at 0.219 (if effectively broken down, the trend is questionable, need to exit and observe)
▶️ **Acceleration Signal**: Closing above 0.228 on the 4-hour chart and trading volume increasing more than 20%, confirming the main upward wave starts.
▶️ **Time Window**: Pullback adjustment does not exceed 3 4-hour K-lines; if it exceeds without rebounding, be cautious of weak trend risks.
In crypto trading, the trend is king! If you want to seize the bullish dividend of DOGE, closely follow the trend structure trading method, pay attention to me, and more currency trend logic will be analyzed subsequently, allowing you to accurately grasp market rhythm, like + follow, in the crypto world, eat meat without getting lost~
