If your funds are within 50,000, and you want to achieve quick success in the crypto circle through short-term trading, please read this post carefully. After reading, you will have a profound understanding of the essence of short-term trading!
I was born in 1987 and have been in the crypto circle for ten years, fully trading cryptocurrencies to support my family for five years!
Not choosing finance or computer science as my major in college is one of my life's greatest regrets. I started exploring Bitcoin and blockchain online quite early, and the enchanting K-line charts and revolutionary concepts captivated me. With endless anticipation for the crypto world, I participated in trading in the early days, thus beginning this journey filled with challenges and opportunities.
Like most friends who just entered the circle not long ago, I initially became obsessed with various technical indicators and on-chain data, continuously backtesting, trying to find the 'holy grail'; eager to bottom fish 'low-priced' altcoins or those that had already dropped 90%, thinking their 'margin of safety' was higher. The harsh reality taught me that most of these initial market perceptions are erroneous and dangerous.
I later painfully realized: If you want to quickly and relatively controllably earn profits in the highly volatile, 24/7 crypto market, focusing on short-term trending hotspots is almost the only viable path (for small funds). The core of short-term trading lies in identifying the mainstream narrative tracks of the market and accurately grasping emotional cycles. Mainstream narratives give rise to leading coins, and the explosive rise of leading coins, in turn, reinforces and spreads that narrative. Often, the greatest contribution to your account and the highest efficiency come from capturing those few leading coins during specific phases. In a raging bull market, they provide the strongest explosive force; in local rebounds, they tend to start first and are relatively 'anti-fall' (note: 'safety' in the crypto circle is relative!). In 2021, I also captured the most rapid upward waves of my career in leading coins such as SOL and MATIC.
Buying the same coin at different stages of market sentiment and narrative cycles can yield vastly different results! The emotional cycle tells you when to boldly attack or even leverage (cautiously!), when to restrain yourself or even short (if capable), and when to completely exit and observe. The mainstream narrative of the market tells you which direction the funds are attacking (Is it AI, MEME, a new public chain, or Layer 2?). This is the correct top-down speculative mindset. Unfortunately, many friends have completely reversed this, going against market sentiment and are naturally harvested mercilessly.
There is a phrase that deeply impressed me: 'If you do not occupy the cognitive high ground of the mind, FUD (Fear, Uncertainty, Doubt) and FOMO (Fear of Missing Out) will occupy it.'
Today, I share with you this set of short-term survival and offensive principles in the crypto circle, which support my survival and continuous profit in this market that is bloodier, faster, and more unpredictable than the stock market. If you can calm down to understand, practice, and ultimately internalize it, your understanding of 'trading coins' will surely undergo a tremendous transformation!
Closely follow Bitcoin's price fluctuations
Bitcoin is known as the barometer of the crypto circle, and most small coins' price fluctuations are influenced by it. Coins like Ethereum, which have stronger conceptual logic, occasionally deviate from Bitcoin to show unilateral trends, but other altcoins generally struggle to escape Bitcoin's 'control.' Therefore, closely monitoring Bitcoin's trading fluctuations can provide important references for trading other coins.
Seize the golden moments of trading
Every day from midnight to 1 AM is a special trading period in the crypto circle, where 'money-making lights' phenomena are likely to occur. This is the period of low trading volume in most parts of the world, and any unexpected situations can happen. Friends who want to buy low or sell high can place a super low buy order before sleep or set a desired selling price, and they might be lucky enough to have their orders executed.
Pay attention to USDT price trends
Generally, USDT and Bitcoin move inversely. When you notice USDT rapidly rising, be alert for a potential Bitcoin crash; conversely, when Bitcoin is rising, it often represents a golden low point for buying USDT. By understanding the price trend relationship between the two, better trading decisions can be made.
Pay attention to the financial news from various central banks
The turbulence in the crypto circle is greatly influenced by various countries' governments' attitudes towards Bitcoin. If the government takes punitive or controlling measures, the market is likely to fall. In addition, changes in U.S. financial policies, such as the recent announcement of a wealth tax on the rich, can also have a significant impact on the crypto circle. Therefore, keeping an eye on financial news from various central banks is an essential task for traders.
Grasp key time periods
Every morning from 6 to 8 is a key period for judging buying and selling, and it can also help determine the day's rise or fall trend. If the market drops continuously from midnight to 6 AM, and it is still dropping during this time, it is a good opportunity to buy or add positions; the probability of a rise that day is high. Conversely, if the market has been rising from midnight to 6 AM, and it is still rising during this time, it is an opportunity to sell; the probability of a drop that day is high.
Pay attention to 'Black Friday'
There is a saying in the crypto circle about 'Black Friday,' where price drops frequently occur on Fridays, but there are also times of sideways movement or significant rises. Although not particularly accurate, it still requires some attention to the news.
Value trading volume
Trading volume is the lifeline of digital currency. For cryptocurrencies with a certain trading volume guarantee, if the price drops, there is no need to worry too much; patiently holding has a high probability of breaking even. It could be as short as a week or as long as a month. If you have extra money, you can average down by buying in batches, which will help you break even faster; if you don't have extra money, just be patient and often it won't disappoint.
Avoid frequent trading
For the same cryptocurrency, holding it long-term usually has much higher returns than frequent trading, which tests the investor's patience. Frequent trading not only increases transaction costs but also easily leads to erroneous decisions due to emotional fluctuations.
The application of K-line moving averages
In crypto trading, K-line theory has a certain applicability, but not all indicator analyses are useful. Although the accuracy of K-line techniques is not one hundred percent, many people find them not very useful after learning. However, based on the experiences of many experts, K-line techniques play a key role in analyzing the long-term price trends of coins. Regardless of the coin price direction, it will be reflected in trading. We can use these techniques to understand the price movements of coins.
Moving average rule: Constructing trend frameworks
In the trend cycle of the one-hour chart, we can use three EMA moving averages to construct a trend framework: the fast line 21 represents short-term momentum, the middle line 55 reflects medium-term direction, and the slow line 144 defines long-term trends. When the moving averages present a 'fast line > middle line > slow line' bullish arrangement, the market is in a strong upward cycle; conversely, it is dominated by bears. This arrangement can effectively filter out noise; even if the moving averages show a turn, as long as the order of arrangement remains unchanged, the trend direction is still valid.
However, the moving average has the drawback of lagging. We can compensate for this through the 'Trend K-Line Confirmation' mechanism: when the price breaks through the moving average arrangement, wait for the 15-minute chart to show the same direction K-line (such as a large bullish line in an upward trend) before entering the market. This can avoid false breakouts and capture the trend acceleration phase. The parameter selection also has its logic; the 21-period corresponds to monthly fluctuations, the 55-period aligns with quarterly trends, and the 144-period resonates with annual lines. This combination has shown a stable win rate of over 65% in historical backtesting of forex, futures, and other varieties, with a profit-loss ratio of 1:2.3.
The support and resistance effects of moving averages
Important parameter moving averages have support and resistance effects. When the market tests important parameter moving averages from below to above, it faces pressure, with expectations of a pullback or reversal downwards; when the market tests important parameter moving averages from above to below, it gains support, with expectations of a pullback or reversal upwards. In practice, we can select these important parameter moving averages and combine them with some reversal structures or patterns for trading.
For example, in the ETH/USDT 1-hour chart in May 2024, EMA21/55/144 showed a bullish arrangement, but the price repeatedly failed to break below the 55 moving average three times. At this time, observe the 15-minute chart and find that each retest is accompanied by shrinking volume and a doji pattern, which is a typical 'trend continuation signal.' Ultimately, ETH broke through the previous high with a single wave increase of 37%.
Crossing of moving averages to judge trends and timing for entry
The crossing of moving averages is also a commonly used analysis method. Add two moving averages to the chart; the one with a smaller parameter is the fast line, which changes quickly; the one with a larger parameter is the slow line, which changes slowly. There are two main uses for moving average crossovers: first, to determine direction; when the slow line crosses above the fast line, it is a confirmation of a bullish trend; when the slow line crosses below the fast line, it is a confirmation of a bearish trend. Second, to determine entry signals; when the slow line crosses above the fast line, it signals entering a long position; when the slow line crosses below the fast line, it signals entering a short position.
For example, in a one-hour K-line chart of spot gold, when the K-line crosses below the moving average, it indicates a bearish trend. Wait for the K-line to retest the moving average and find resistance before breaking below the previous low point to enter short, setting the stop-loss at the high point of the pullback. After the first order enters and the market experiences a decline, it retests the moving average, finds resistance, and after breaking the low again, you can enter to add positions.
Combining moving averages with other indicators
Moving averages can be combined with indicators like Fibonacci and MACD to enhance the accuracy of trading decisions. For example, after confirming the direction with a moving average golden cross or death cross, the market usually has run a certain distance; at this point, entering may yield an unreasonable profit-loss ratio. By combining with Fibonacci, you can find key positions for trend pullbacks to enter, with smaller stop-loss space and a more reasonable profit-loss ratio.
For example, when the market tests the moving average with expectations of a reversal, if the MACD also shows a divergence pattern, it forms a resonance for market reversal. You can combine this with smaller moving averages for entry, which minimizes stop-loss space; if the market moves favorably, the profit-loss ratio will be more ideal.
Trading is a long-term practice. To gain something in the crypto circle, one must adhere to rules and build their trading system. I hope this set of trading strategies can provide beneficial references for your trading in the crypto circle and wish everyone can achieve ideal returns.
The key point is coming! Next, I will share the application of K-line moving averages. We all know the importance of K-lines in the stock market.
In the crypto circle, these K-line theories only apply to a portion of situations. Not all indicator analyses are effective in the crypto circle.
Although the accuracy of K-line techniques is not one hundred percent, and many K-line knowledge may seem useless after learning,
In fact, based on the experiences of many experts, K-line techniques play a key role in long-term analysis of coin prices.
Regardless of which direction the coin price is heading, it will be reflected in trading. We can use these techniques to understand
the price movement; K-lines indicate the probabilities, guiding you towards a bright path when you feel lost.
Without further ado, let's get to the point.
Today mainly discusses basic indicator strategies:
1. Methods and settings for moving averages.
2. RSI Indicator Usage 3 Value Investment
1. How to use moving averages to judge trends
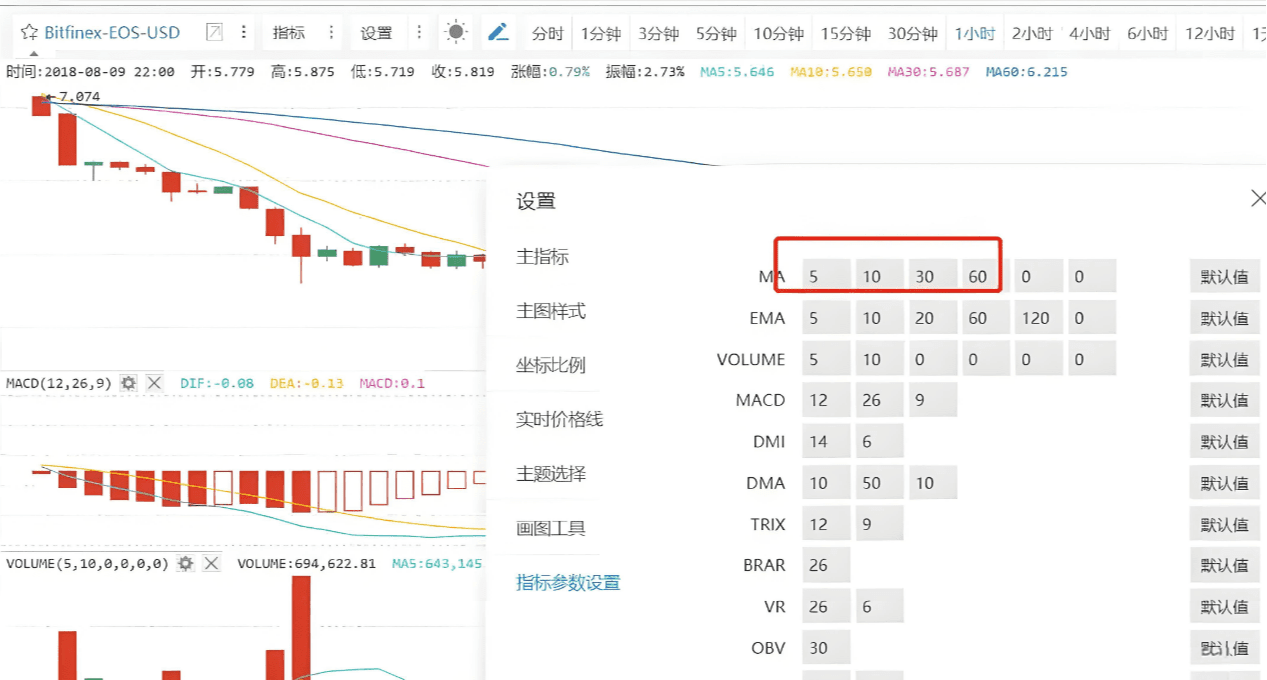
1. First, let's learn how to set indicators.
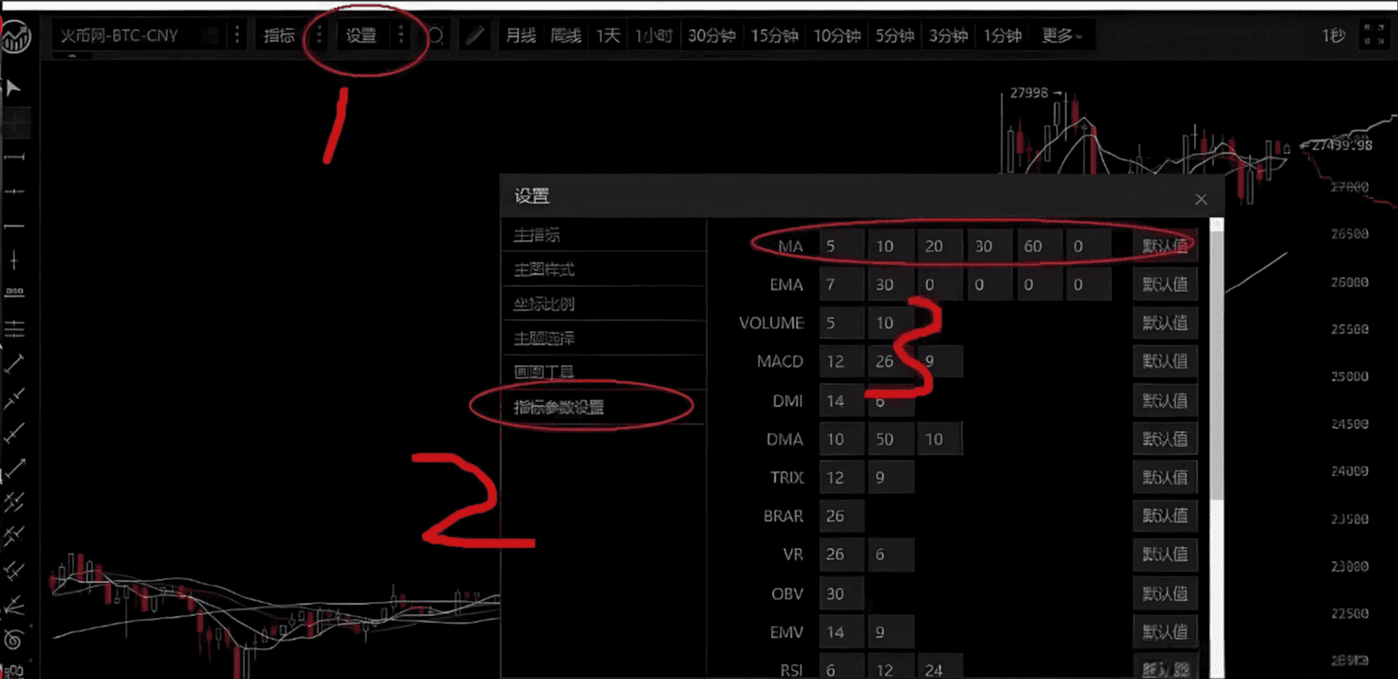
Due to some updates on the exchange, if friends can't find it, they can directly click on the line with the mouse.
You can see these lines; just click on the line to change it.
After clicking here, you can directly change it. The moving averages we need to use are: 5-day line, 30-day moving average, 60-day moving average, and 120-day moving average. If you feel it is not useful, you can even change the 5-day line to a 4-day line for more agile market reactions.
2. Short-term moving average indicators: 5-day line strategy.
The commonly used short-term line is the 5-day line.
What is the 5-day line? The 5-day line is the sum of the closing prices over five days divided by five.
Generally, the system is set to the weekly line, which, in simple terms, is based on the average price over a week as the moving average. However, a week's time is too long and reflects relatively slowly. Of course, some experts use four-day lines, etc.; these can be visually displayed through settings.
The 5-day line is the most practical for short-term judgment.
The 5-day line represents the average price level held by everyone over the past five days, indicating buy and sell signals within those five days, reflecting everyone's acceptable range and average holding cost.
Similarly, changing the moving average follows the same principle.
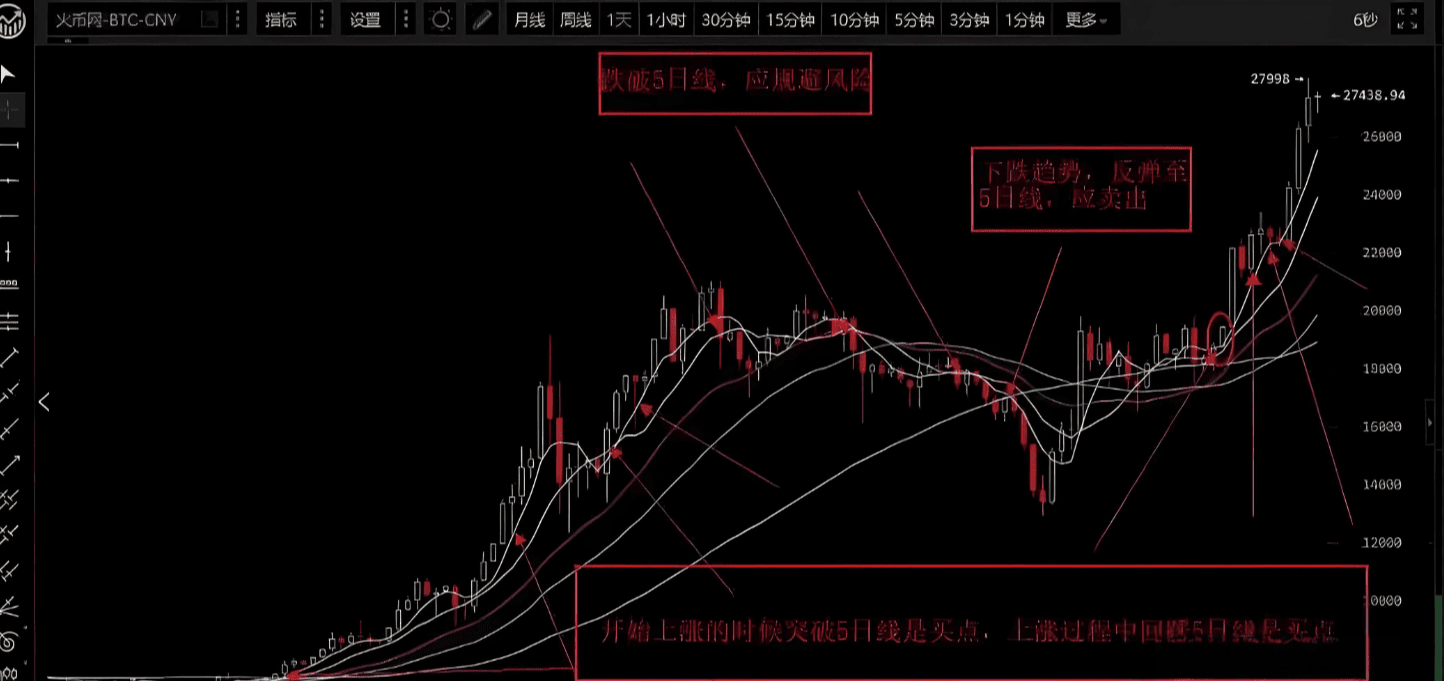
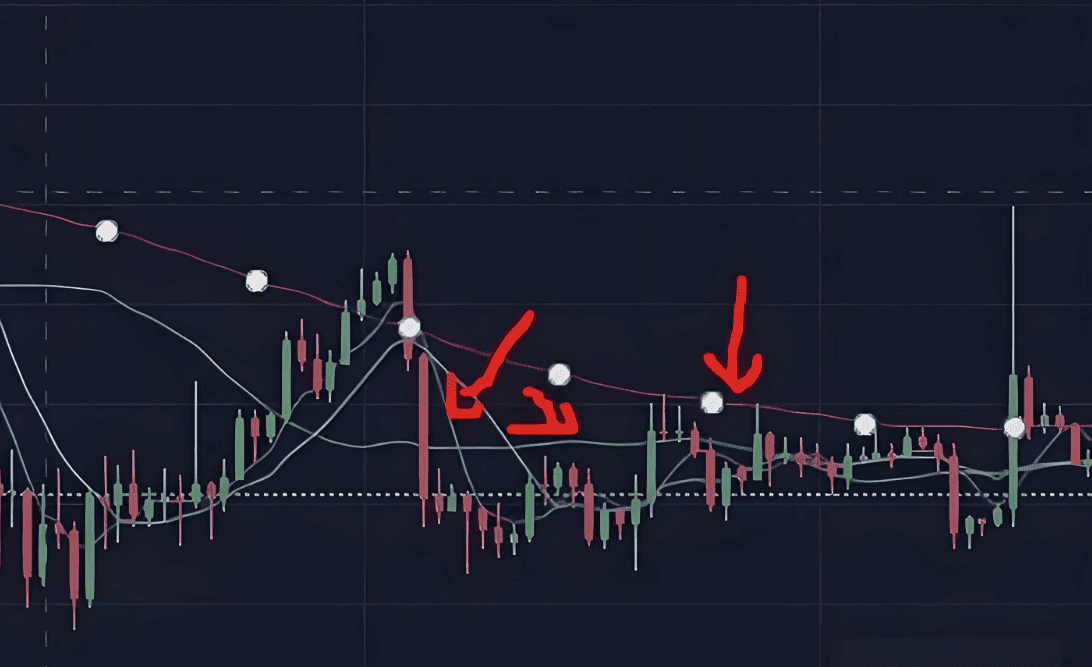
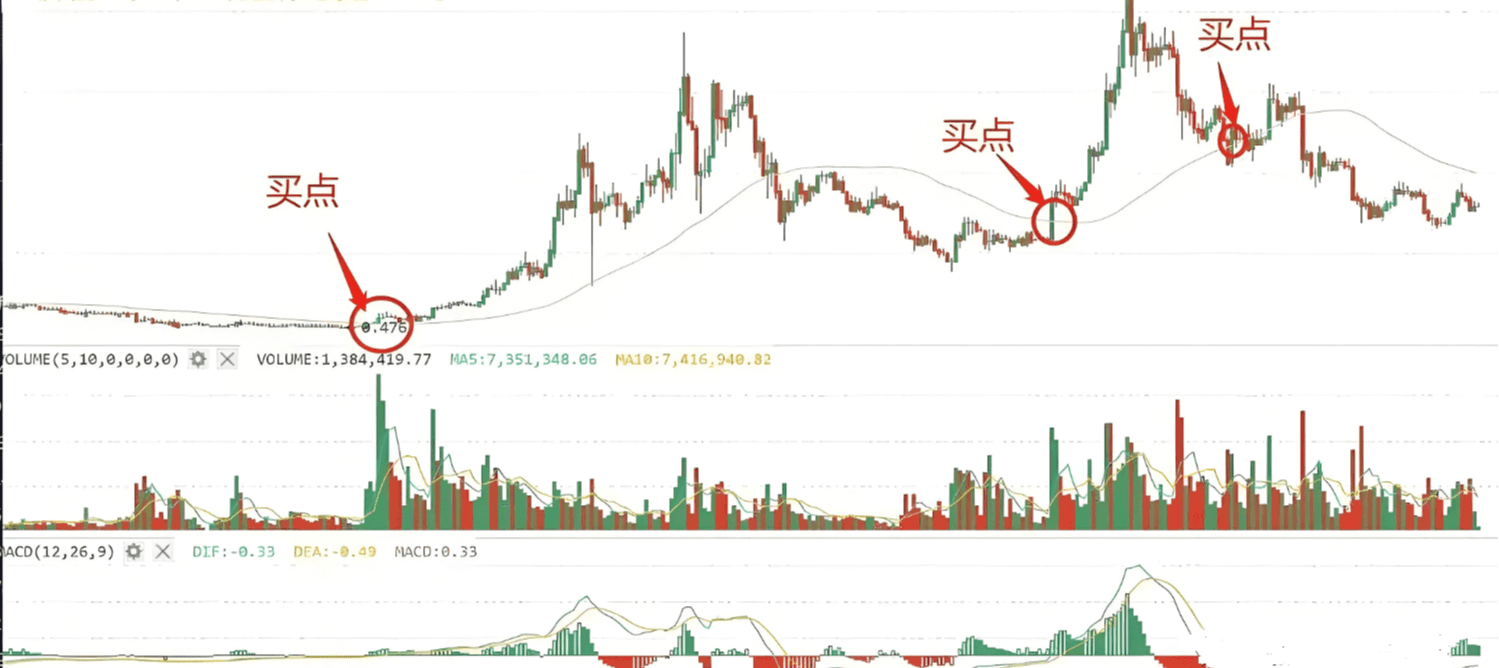
Usage: In a bull market, when the price retraces to the 5-day line, it is time to add positions (if it breaks through quickly, you should observe); in a bear market, when the price breaks below the 5-day line, you must sell quickly. As long as it does not break the 5-day line, there should not be major issues. During a consolidation period, you can look at the 1-hour and 4-hour lines; this is the usage for short-term trading.
This theory requires more exploration, as very few people will tell you that you will encounter many issues in practice. You need to verify more. Undoubtedly, the 5-day line strategy is highly useful in practice and is one of the indicators that short-term experts must rely on.
Why use the 5-day line? Because there is a saying that in the crypto circle, one day is equivalent to a year in the human world, and the market reacts particularly quickly. Using the conventional 7-day line would be relatively sluggish and unable to keep up with market direction changes. We all know that the price fluctuations in the crypto circle are unlimited, and trading occurs even 24 hours a day.
If using the 5-day line as a judgment standard, when the price reaches the 5-day line, it will form a support level. If sold, it will break below the 5-day line, and once you wait for it to return to the cost price, you can only wait, and this point becomes a support level.
It shows that the current price has not yet stood above the 5-day line, and there are many uncertainties. At this time, we should use the one-hour and four-hour lines.
Practical summary: This set of strategies primarily focuses on short-term indicators; when approaching the moving average, which is essentially everyone's cost price, selling pressure decreases, and prices will relatively rise again. If the deviation from the moving average is too large, the probability of adjustment increases, mainly because investors will opt for arbitrage, leading to a price drop.
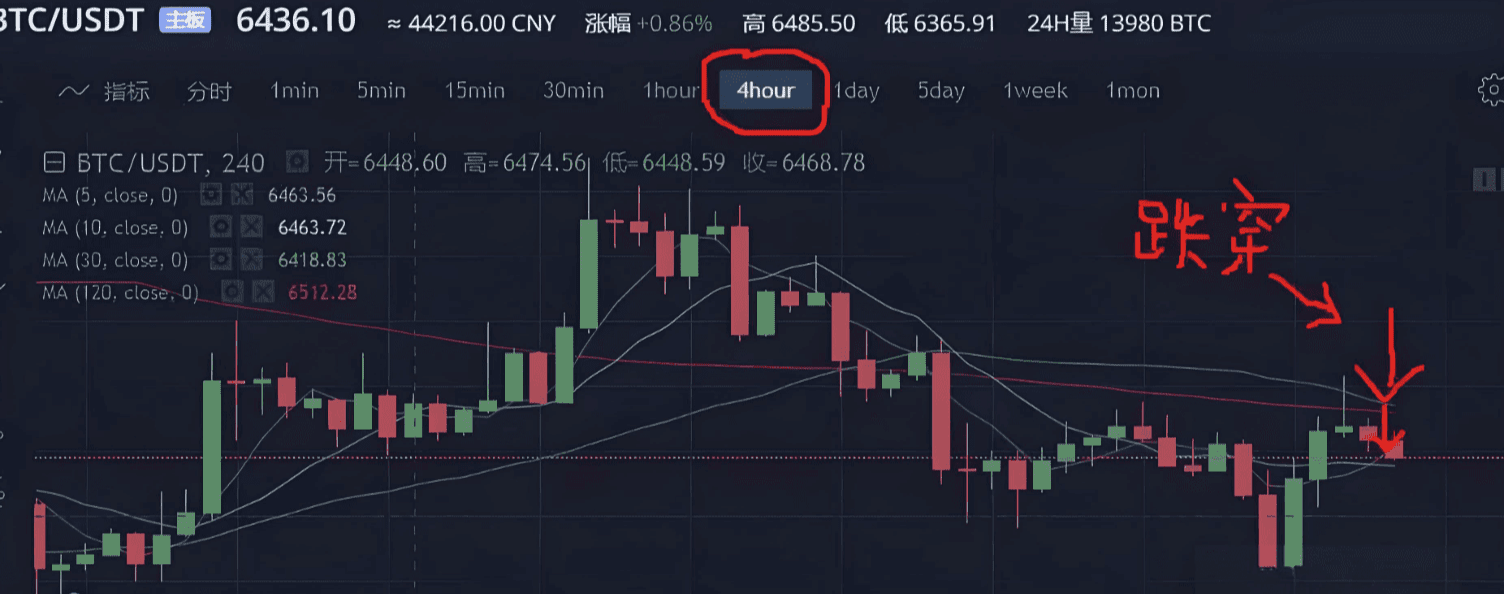
3. Short-term strategy with the combination of the 30-day line and the 10-day line:
The 30-day line is also a short to medium-term play; if you are not very keen on trading, we recommend this set of strategies.
As per the old rule, if you previously set: 5-day line, 30-day line, 60-day line, 120-day line, change the 60-day line to a 10-day line.
Because this set of indicators only requires the 10-day line and the 30-day line.
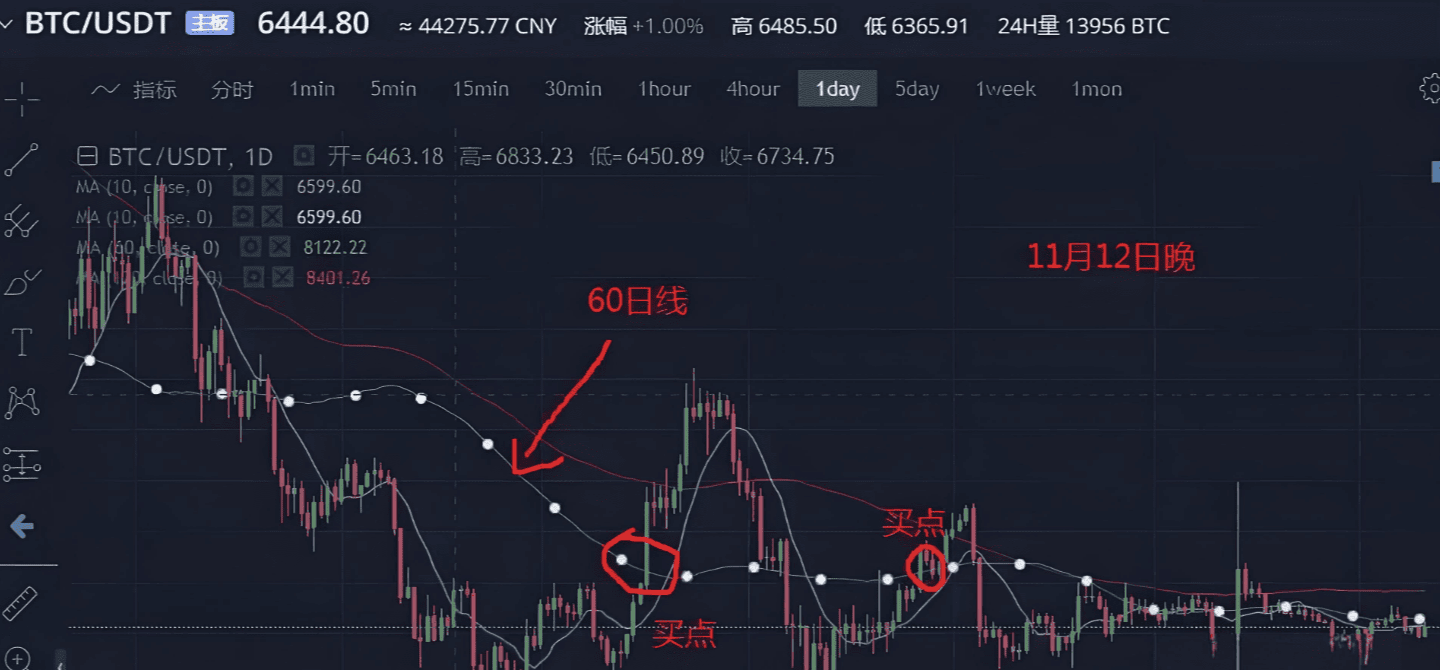
This set of indicators is relatively simple to use: sell when breaking below the 10-day line, buy when breaking above the 30-day line. Change the time frame to one hour, as detailed in the figure.
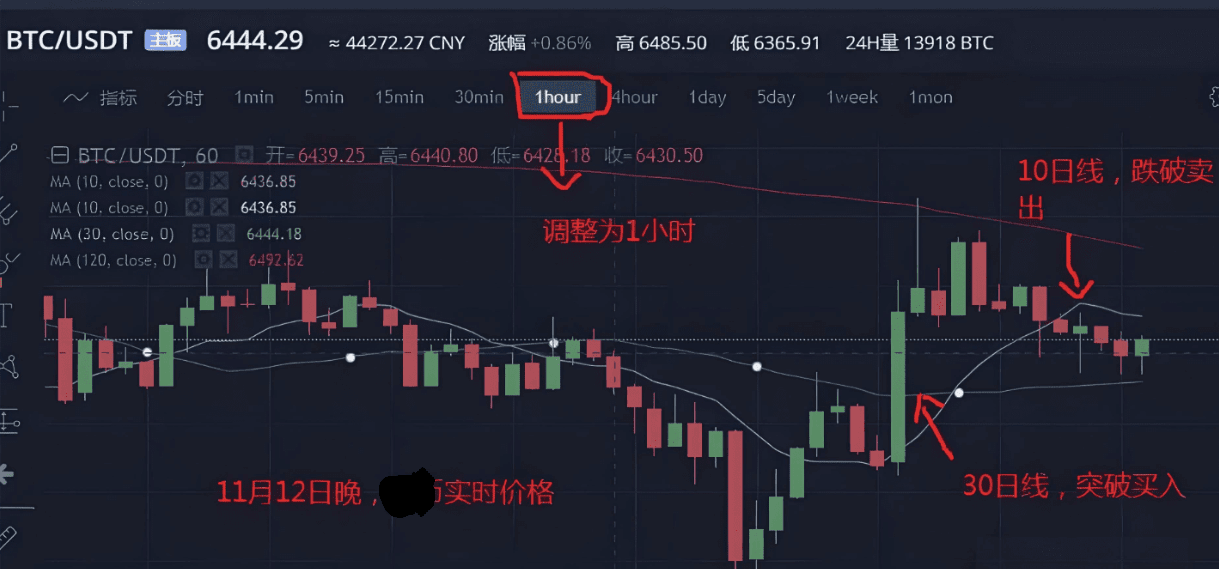
This theory is similar to the 5-day line; the 30-day line represents the short to medium-term trend. Setting it to one hour turns it into a short-term buying point, and if it breaks below the 10-day line, a short-term downward channel opens. By combining these and applying them in real practice, the effect is significant.
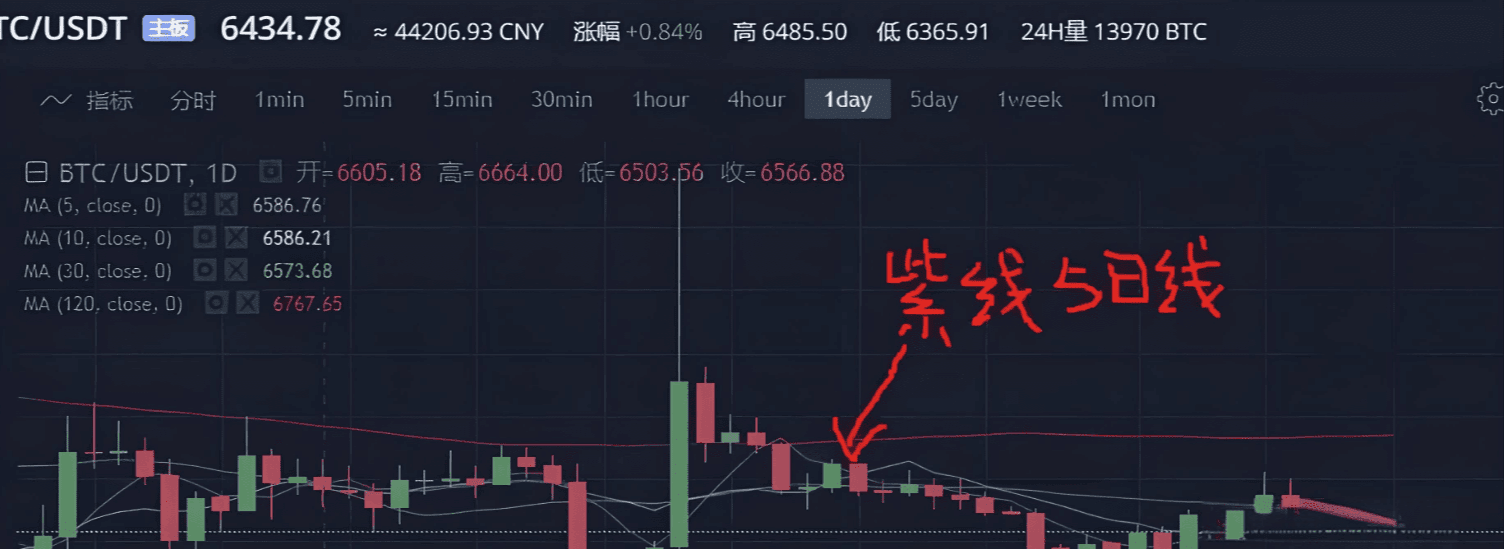
4. Mid to long-term strategy: 60-day line and 120-day line.
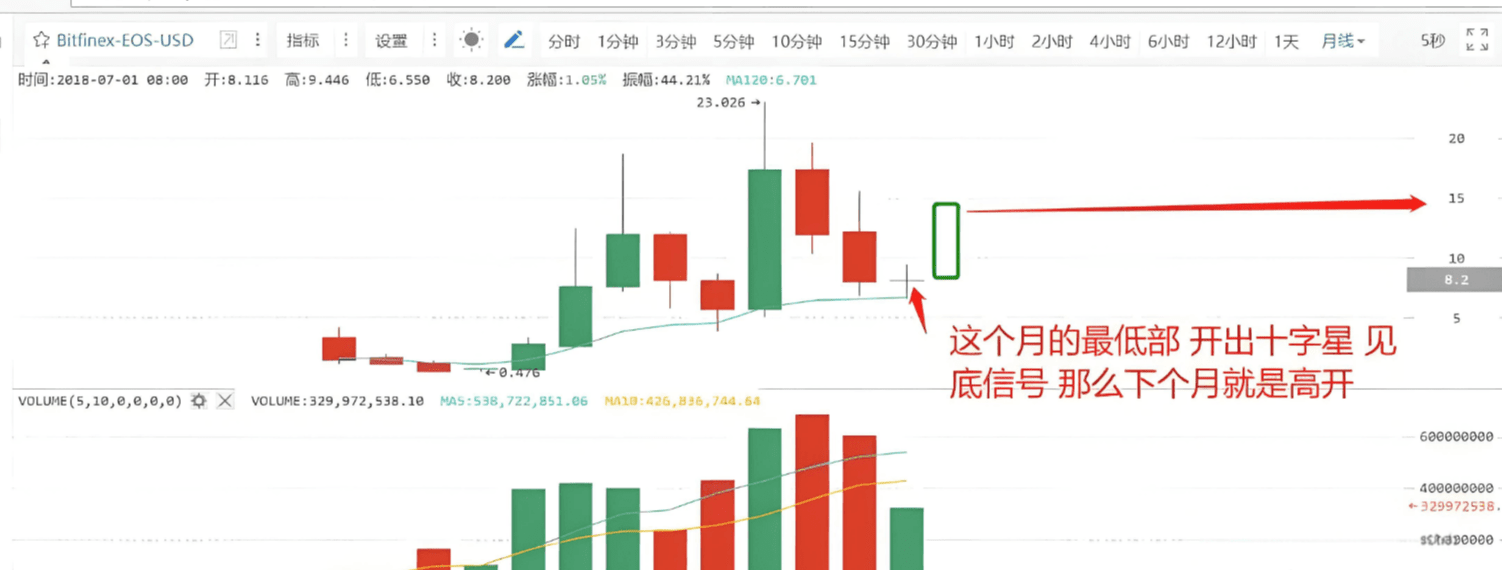
 This chart shows the trend of EOS. It is said that some investors trade the 60-day line several times a year to invest conservatively. This method is suitable for those who do not have time for trading.
 When it comes to the 120-day line, it is the boundary between bulls and bears.
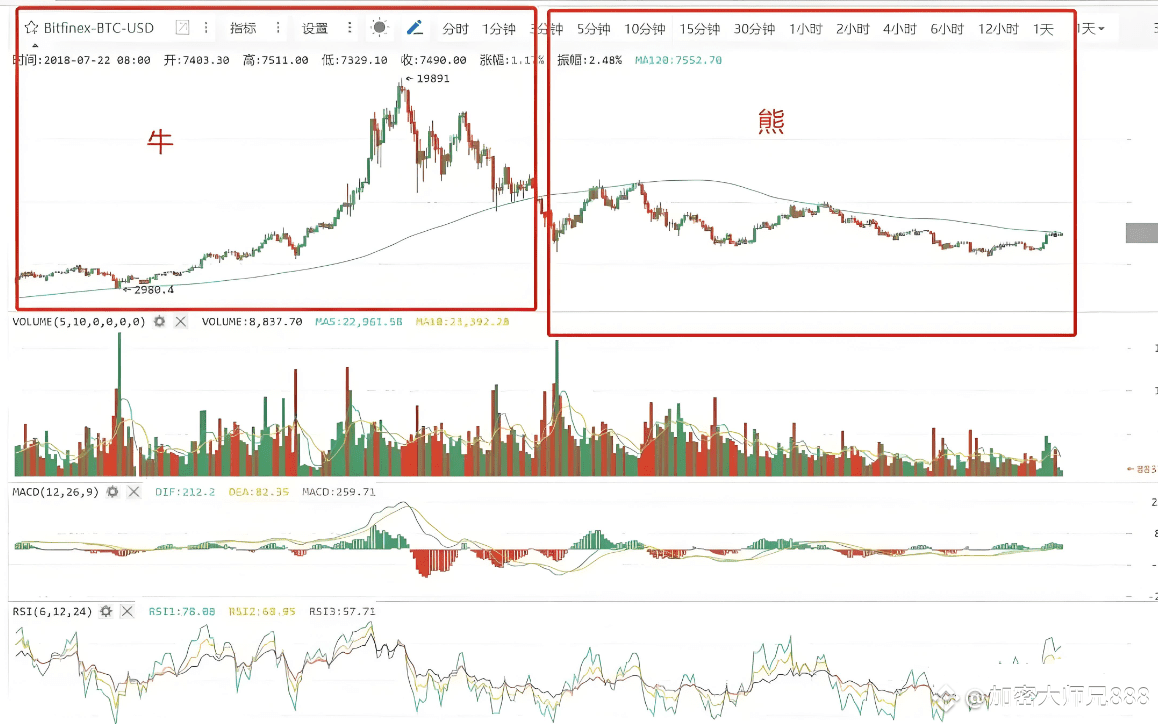
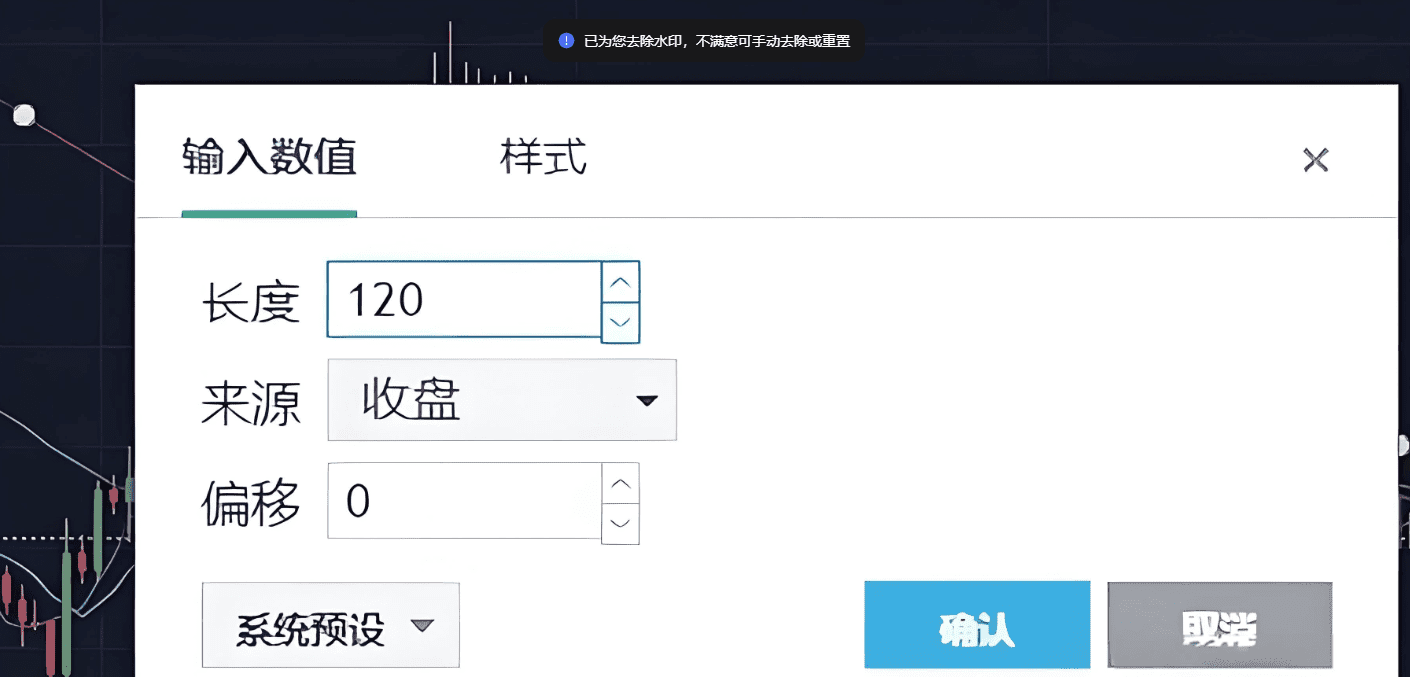
So how to use the 120-day line for investment?
This is the previous technical chart, and according to the current market, it has never broken through the 120-day line. The use of the 120-day line is essentially a technical indicator for judging long-term trends. In daily trading, it is also a reference. This bear market has not ended yet, and once it breaks through the 120-day line, it will be an indicator for judging the arrival of a bull market.
We often see that the so-called support and resistance levels mentioned by various experts are essentially moving averages. When analyzing major trends, long-term investors should not rely on the five-day line strategy; the main reference moving average for bull and bear transitions is the 120-day moving average.
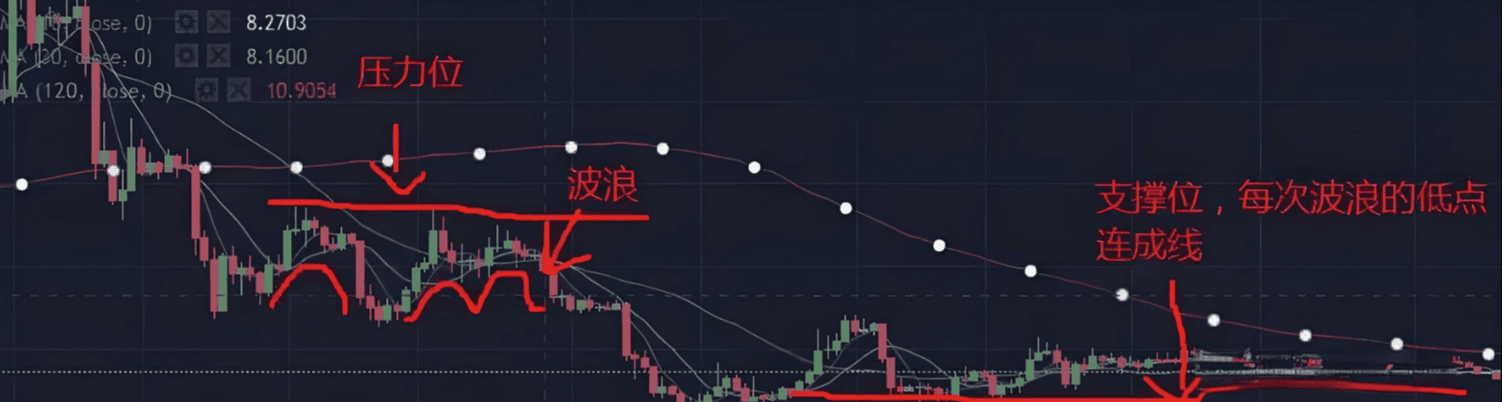
5. Box waves look at pressure and support.
This is from Elliott Wave Theory, which explains the wave trading method well. Many beginners in the stock market have relied on this theory to sweep the market for many years. Of course, its practicality is unknown; after all, seeing is believing. Here, we will simply introduce the box wave support and resistance levels.
When the coin price operates within a certain box, the highest point of each wave forms a line, which is the resistance level, while the bottom of the wave forms a line as the support level.
The general judgment is that a breakout may lead to a higher charge. In such cases, how should one choose?
One main point comes from the fundamentals; for example, the release of positive news or the entry of large capital can create a wave of market momentum, while another situation is a breakout followed by consolidation, which is also relatively common, indicating that the funds are unable to push higher or that there is too much selling pressure. At this time, caution is warranted; however, such spans can be quite large and serve only as a reference.
 Using box waves to look at each low and high point to determine support and resistance is also a relatively common analysis method. It is mindlessly simple, but not that accurate. You can explore in daily practice or refer to wave theory technical books. To be honest, I have read several good wave books, but their practical application is not very effective. However, this does not mean that everyone will not see results after reading; everything still relies on practical exploration. I prefer practical techniques rather than conceptual things; what do you think?
6. RSI bottom fishing and topping rules
RSI is also an old technical indicator in the stock market and works particularly well as a reference in the crypto circle.
The RSI indicator represents a level of strength, calculated based on the statistical increase and decrease of the coin price.
The principle of the RSI indicator is simply to calculate the strength comparison between buyers and sellers. For instance, if a hundred people buy a coin, sixty buy and forty sell, the coin price will rise.
So how to use it? A score of 80 to 100 indicates a strong sell; 20 to 50 indicates a strong buy; a weak observation between 0 and 20 means extremely weak buying. Once a golden cross occurs, it becomes a buying or selling point.
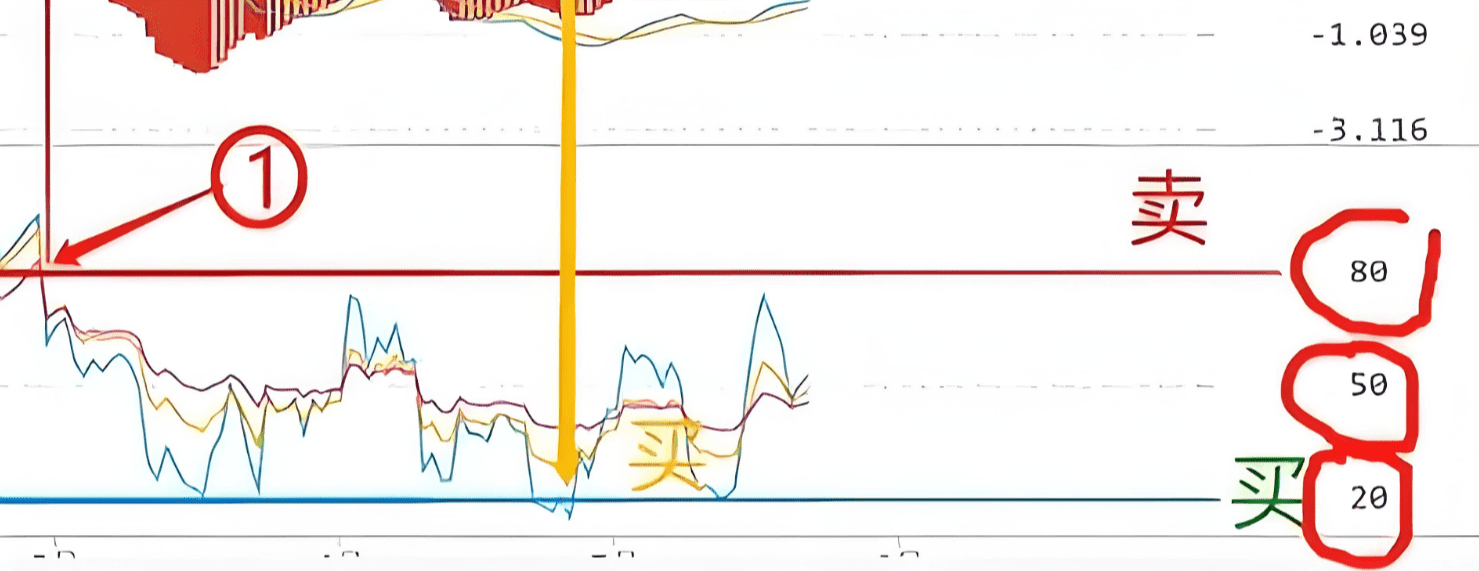
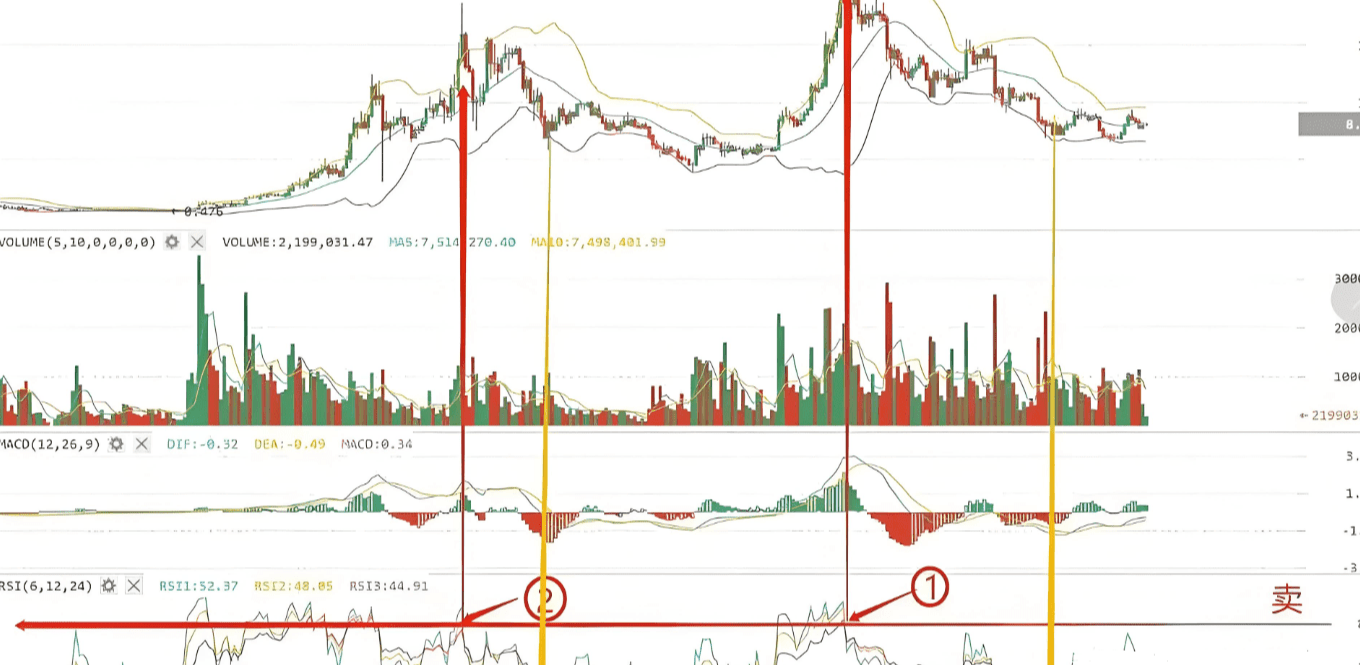
Note that if it reaches 80, there is a significant risk of pullback. So when should you sell? Sell at the moment it breaks below 80. The RSI technique has been validated in the market; it has been used since it was researched in 1978, showing its reference value. In the emerging crypto circle, this set of indicators can also effectively lead you to victory.
For short-term swings, you can choose the one-hour line to operate and achieve swing tops.
In summary: today we reviewed five types of indicator techniques: the 5-day line strategy, the combination of the 10-day and 30-day lines with indicators, the role of the 60-day and 120-day lines in mid to long-term strategies, box wave support and resistance levels, and the RSI bottom fishing and topping rules. The aforementioned reference indicators, although many are quite simple, are often more effective in practice. Through practical investment, I believe at least one of these can provide you with a unique investment experience, and one can become a powerful tool on your investment journey.
Remember, the crypto circle is not lacking in opportunities, but in the execution force to keep up.
The old blog only conducts real trading; those in the team should hurry to get in.


