Hello everyone, I am Chain World Scholar, a blogger focused on practical analysis in the cryptocurrency circle.
Today we will discuss the most commonly used and important technical analysis basics in the cryptocurrency circle—support and resistance levels.
They are the core tools for judging whether the price of the coin will rebound or decline. Mastering them will help you avoid chasing highs and cutting losses, allowing you to capture the real market trends.
1. What are support and resistance levels?
Support Level
A support level is a position where buying pressure increases when the price falls to a certain level, making it difficult to continue to break down. It can be understood as 'the floor of the price'.
Resistance Level
A resistance level is a point where selling pressure increases when the price rises to a certain height, making it difficult to break through. It can be understood as 'the ceiling of the price'.
Remember this sentence:
Support is the bottom protected by buying, resistance is the wall capped by shorts.
2. Why do these positions become support/resistance?
🔍 The principle is simple: it is actually a reproduction of market sentiment + historical behavioral patterns.
Many people buy near support because everyone feels the price is 'very cheap'.
Many people sell near resistance because they feel 'it's almost at the top'.
Moreover, many people have set stop-loss and take-profit orders near these key price levels, so when the price approaches these areas, a large number of transactions occur, making it difficult to break through.
3. How to find support and resistance levels?
Next, let's talk about the key points: five common methods to help you quickly identify support and resistance!
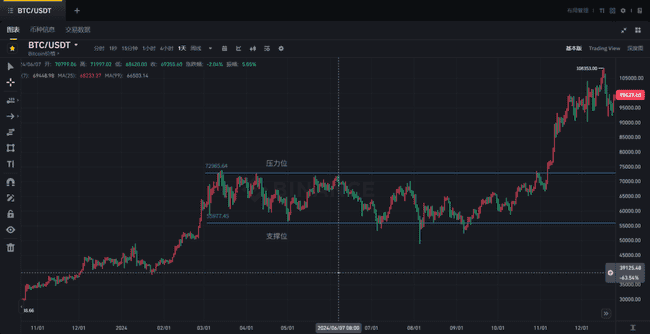
Method 1: Previous highs/lows method (the most basic)
If the price has historically stopped falling/rising multiple times at a certain point, then this point will be the future support/resistance.
Example:
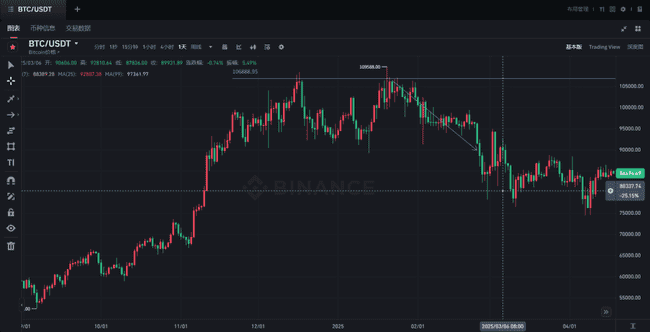
Bitcoin reached a new high near $106,800 and then stopped rising → this position is a clear resistance level.
Method 2: Round number method
The market has a natural psychological expectation for 'round numbers', such as BTC's 20,000, 30,000, 50,000, which often become support/resistance levels.
Example:
Many people set stop-loss and take-profit at 30,000, resulting in dense trading at this point, forming pressure/support.
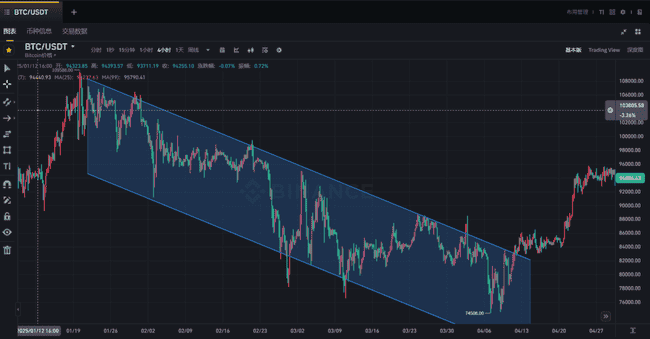
Method 3: Trend lines/channels
Connect two or more high or low points to draw a trend line.
If the trend line is rising, the line is support; if the trend line is falling, the line is resistance.
Method 4: Moving average method (e.g., MA20, MA50)
Moving averages are the moving average lines of prices, and many people treat them as dynamic support/resistance levels.
Example:
BTC repeatedly touches MA20 during the upward process but does not break → MA20 is a dynamic support.
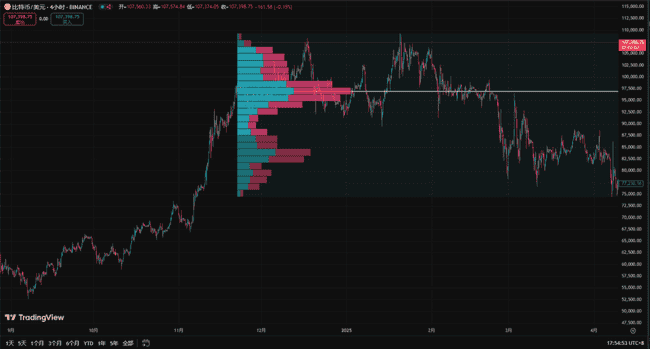
Method 5: High transaction density area (chip concentration area)
Areas with large trading volumes are usually regions of intense competition between buyers and sellers, easily forming important support/resistance.
4. The conversion of support and resistance levels
Many people don't know: support and resistance levels can transform into each other!
Remember this rule:
Once resistance is broken, it becomes new support;
Once support is broken, it becomes new resistance.
Finding these points is not for 'divine prediction', but to allow you to make planned trades at critical positions, such as placing buy orders and setting stop-loss.
5. Usage tips and precautions
Tip 1: Support/resistance is not a point, but a range
Don't look too precisely at a specific price; look at the 'nearby area'.
Tip 2: At least two rebounds/declines must confirm for it to be effective
Judging by a single touch is unstable.
Tip 3: Combine with other indicators for judgment
RSI entering oversold at support = high probability rebound point
MACD golden cross + stable support = bullish signal
Conclusion Summary
Support levels are bottoms that are difficult for the price to break, while resistance levels are tops that are hard to surpass.
Can be found through previous highs/lows, trend lines, round numbers, moving averages, and other methods
The most important thing is to plan your buy and sell in advance at key points, and don't chase highs or cut losses!
📣 If you want me to talk about 'how to set stop-loss' and 'how to find entry points with candlesticks' in the next issue, feel free to comment and let me know!
Follow me, and I will teach you how to seek victory steadily in the cryptocurrency circle and become a logical trader!


