TO: Investment Management
FROM: Department of Crypto Asset Strategies
SUBJECT: Assessment of Recent Behavior and Projections for the BNB/USDT Pair
The following detailed report on the current situation of the BNB/USDT pair is presented, based on the analysis of 15-minute, 1-hour, and 4-hour charts captured at 12:20 PM. This analysis integrates the recent evolution of the asset, its technical indicators, and the market factors influencing its price.
1. Summary and General Context
BNB has shown remarkable strength, reaching a new all-time high (ATH) of $900 on August 22, 2025. This rally has been driven by an increase in activity on the BNB Chain network and the confirmation of a double bottom pattern in its charts. The analyzed images, captured around 12:20 PM, show a price of $839.80, reflecting a consolidation phase following the rally, with an increase of +6.86% in the last 24 hours.
The transaction volume remains healthy, with spikes during pullbacks, suggesting strong institutional accumulation and an increase in spot inflows to the second-highest level of 2025. The overall trend remains bullish, with price projections pointing to a next target of $900 and a potential to reach $1,000.
2. Analysis by Time Frame
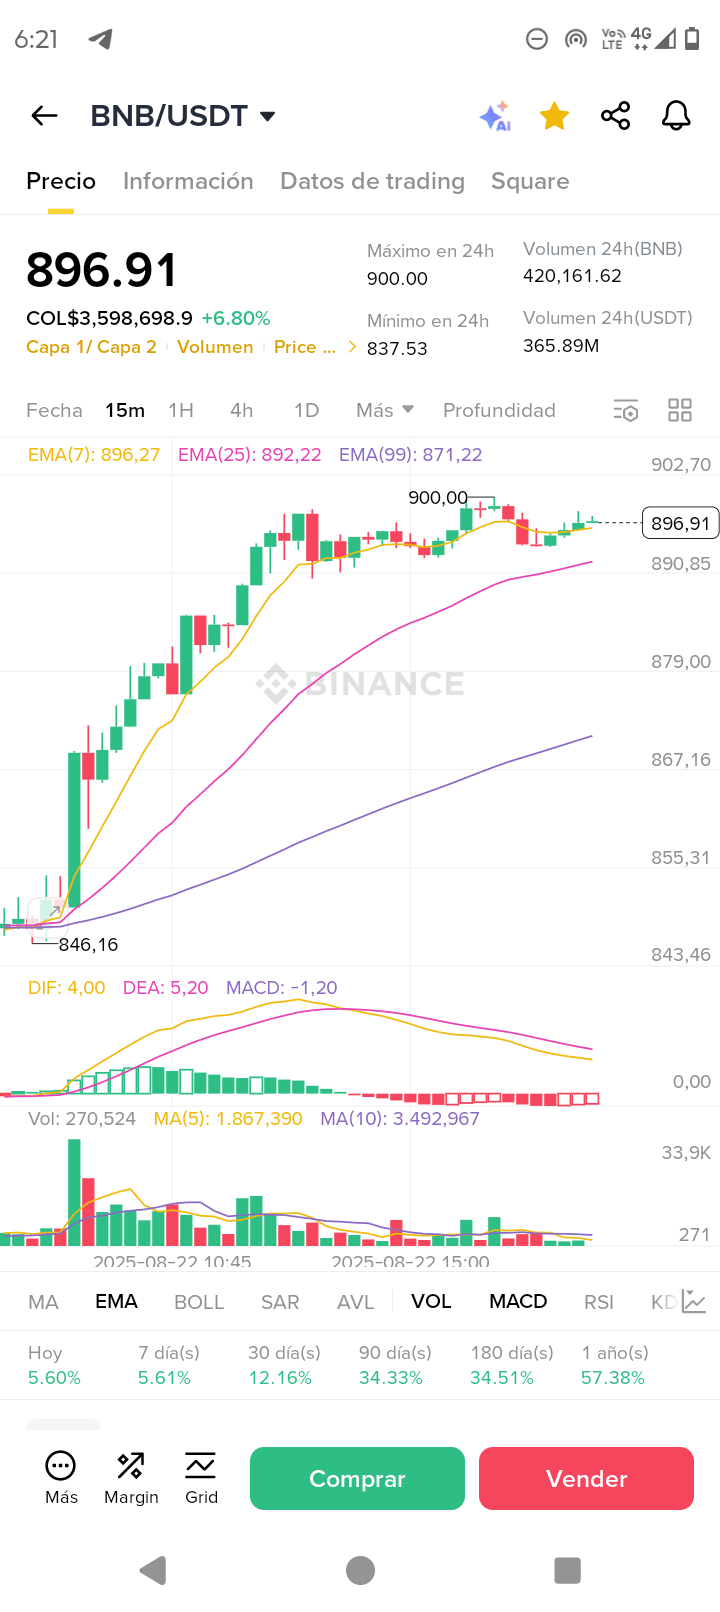
15-Minute Chart ($839.80):
Trend: Immediate bearish. The price has rebounded from $837.96. The MACD is negative, but a positive divergence suggests an imminent reversal.
Conclusion: Buying pressure is evident, with the price attempting to surpass the resistance of $850.
1-Hour Chart ($839.70):
Trend: Bearish consolidation. The price has rebounded from the $837 support and remains below its EMA25 and EMA99, which is a sign of strength.
Indicators: The MACD shows a slight improvement in its divergence, supporting the idea of a short-term trend reversal. The formation of a double bottom at the $837 support confirms the strength of the level.
Conclusion: The current consolidation is expected to serve as a basis for a new push.
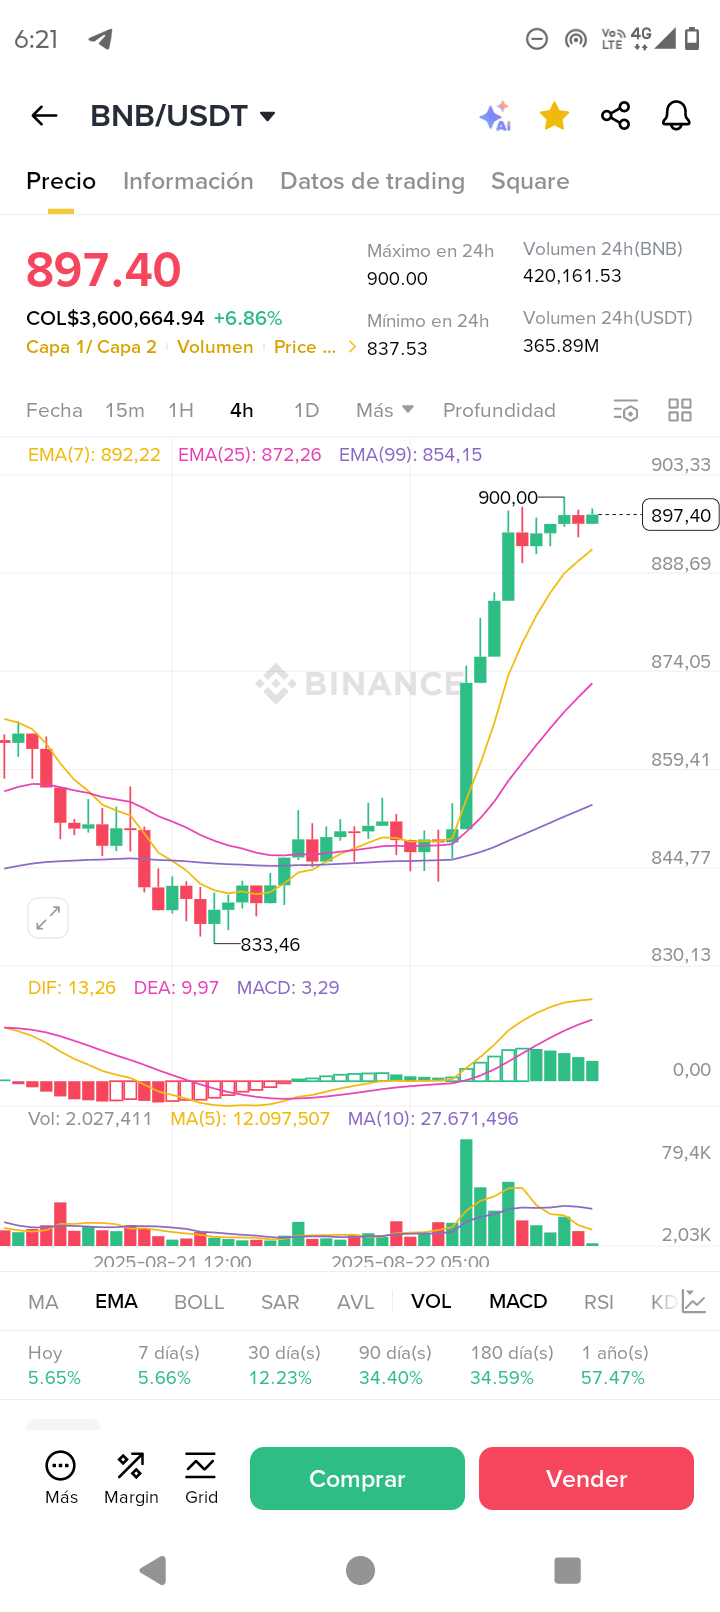
4-Hour Chart ($839.85):
Trend: Bullish in the medium term. Despite a correction, the green candles at the bottom of the chart indicate that buyers are regaining control.
Indicators: The MACD shows exhaustion in the bearish pressure. Consolidation has occurred above key support levels.
Conclusion: The medium-term scenario is favorable, with a potential upward breakout if the resistance of $850 is surpassed.
3. Recommended Operational Strategies
Based on the analysis, the following strategies are suggested, prioritizing risk management:
Main Strategy: Bullish Breakout
Rationale: The indicators and market context are highly bullish. This strategy seeks to capitalize on the momentum of the trend.
Entry Point: An entry is suggested if the price breaks and consolidates above $850.
Objectives: Profit targets are set at $883 and, in the medium term, at $900.
Stop-Loss: A strict stop-loss below $837 is vital.
Alternative Strategy: Pullback
Rationale: For more conservative operators, this strategy allows entry at a solid support level with controlled risk.
Entry Point: An entry is recommended in the $837 - $812 range.
Objectives: The objectives would be the resistance levels of $850 and $883.
Stop-Loss: The recommended stop-loss is below $800.
4. Conclusion and Final Recommendation
BNB/USDT is at a crucial point. The current consolidation following a new ATH suggests a possible continuation of the bullish trend. The best option in this scenario is the bullish breakout strategy, which leverages market momentum and positive sentiment. Trading volume and Bitcoin's behavior should be monitored to validate the movement.
Sincerely,
Management of Crypto Asset Strategies