If your capital is within 500,000 and you want to quickly succeed in the cryptocurrency market through short-term trading, please read this post carefully. I believe that after reading, you will gain a profound understanding of the essence of short-term trading!
I am 34 years old this year, and I have been in the market for 10 years, with 6 years as a full-time cryptocurrency trader!
Not choosing a major in finance in college is one of my biggest regrets. From my first year, I began learning about stocks, finance, and forex online. The red and green screens filled my life with color and fascinated me. With an infinite longing for the market, I opened an account in my second year, slowly learning about the cryptocurrency market and Bitcoin, and through an introduction from a classmate, I learned more and more, becoming very interested and starting my investment career.
Like most friends who have just entered the market, many become fascinated with technical indicators, constantly using cryptocurrencies for backtesting to find patterns; eager to enter low-priced coins or coins that have significantly retraced, believing their safety is higher. In fact, this understanding of the market is completely wrong.
Later, I realized that to quickly achieve returns in the market, you must trade short-term. Combine short and medium-long positions for compounding!
The conclusion is: do not be blinded by the blood of profit; the most difficult thing is how to sustain profits. Be sure to review carefully, whether it is luck or strength, and a stable trading system suitable for you is the way to sustained profits.
There is a saying that left a deep impression on me: if you do not occupy ideology, others will.
Today, I share with you the trading mentality that has allowed me to remain steadfast in the market for a long time. If you learn it seriously, you will gain significantly and fundamentally change your understanding of trading!
How to manage positions in different market conditions? Self-made position ratio (with illustrations)
I believe many people encounter a problem when trading: they do not grasp the cycles well.
For example, I am used to trading on the hourly chart, but when there is no profit space on the hourly chart, I want to find opportunities on the 5-minute chart. Jumping from a large cycle to a small cycle, I still habitually place orders based on the previous position size, which leads to a problem of small profits and large losses. Moreover, I do not control the position and do not know how much position to take each time.
Today, let’s learn how to calculate the size of positions and how to use and obtain the free calculator.
1. The conversion of trading cycles easily leads to small profits and large losses.
Why does the risk-reward ratio remain unchanged while the profit earned on the 5-minute chart is less than that on the hourly chart?
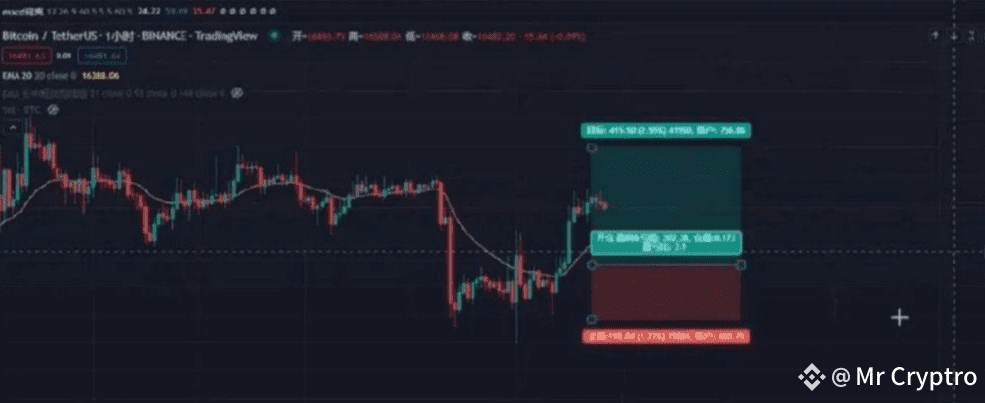
On the hourly chart, we can achieve around 400 points with a 1:2 risk-reward ratio, but on the 5-minute chart in Figure 2.
We can only get 153 points. Under the same position, the earnings from the 5-minute chart and the hourly chart are different. If moving from the hourly chart to the 5-minute chart, it will lead to small profits and large losses.
2. Position management
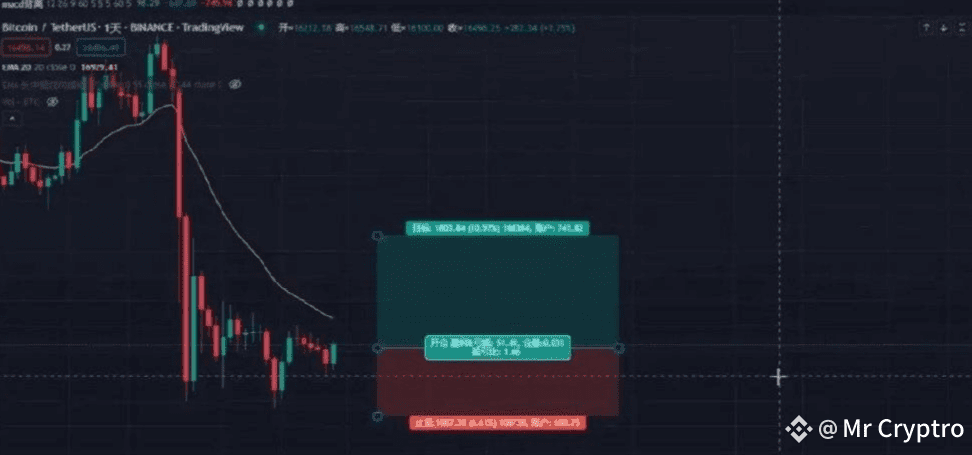
Many people know nothing about position management except for the risk-reward ratio. For example, going long at the position in Figure 3 has a risk-reward ratio of 2.41, and aside from the risk-reward ratio derived from using TradingView tools, there is no other way to start.
Some people always fill their positions with the full amount of their account balance. They cannot clearly identify how much position they should take each time or know how many times to leverage. They do not even know what it means to set positions based on losses.
To facilitate usage, I made a calculator, as shown in Figure 4.
Regarding how to obtain and use this calculator, we will explain later.
In fact, what we earn in trading is volatility points. If we are trading low-leverage contracts on a daily chart, failing to control positions can lead to significant losses.
The position size for trades on the daily chart and hourly chart is different; let's compare. Assuming a maximum loss of 1000 USD each time.
Daily chart:
As shown in Figure 5, the percentage of stop loss on the daily chart is 7.52%, while the take profit is nearly 30%.
Hourly chart: In the hourly chart in Figure 6, the risk-reward ratio is set at 1:2.
At this time, the stop loss ratio is 1.22%, and the take profit only needs to rise to 2.55% for this trade to take profit.
5-minute chart:
Under the same conditions, my risk-reward ratio in the 5-minute chart would be as shown in Figure 7.
The stop loss is only 0.45%, and the take profit is 1.06%.
Then, after comparing these three cycles, will you still think that the same position can be opened for different cycles? Of course not. Because we are capturing the volatility. The risk-reward ratios for each cycle are the same, but the magnitude of the volatility is different. Therefore, under the condition of expected losses and gains being the same, our position should be inversely proportional to the volatility.
3. Usage and explanation of the calculator
To facilitate use, I created a calculator for calculating position sizes, which everyone can use first when entering the market, as shown in Figure 8.
All trading must first think about how much to prepare for a loss; the 'expected loss' in the calculator is the risk control ratio, with position risk using a fixed percentage model.
In the calculator, you only need to fill in the numbers corresponding to the yellow box; the other numbers will be automatically calculated as you input the numbers. Besides the numbers corresponding to the yellow box, do not manually change any other numbers.
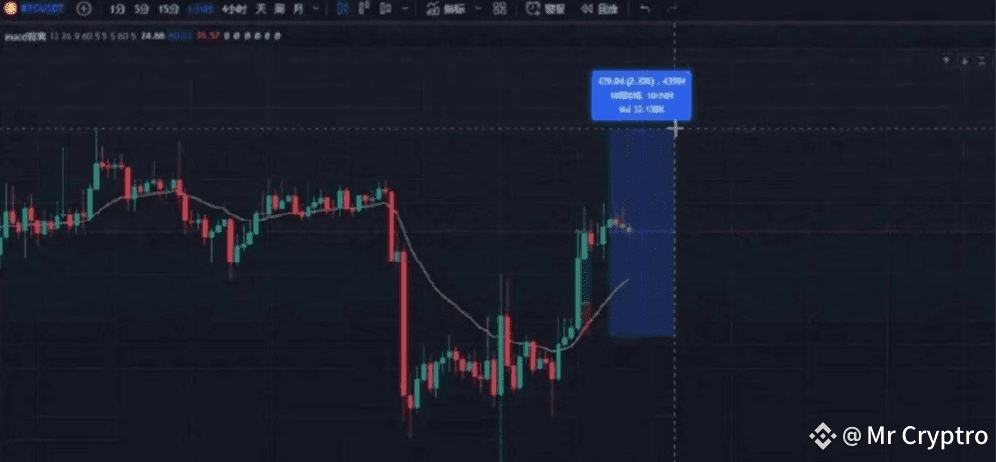
For example, if my account has 1000 USD and I am only willing to lose 5%, I will need to lose 20 times in a row to lose all my money. Therefore, using the risk ratio multiplied by the current account balance (5% * 1000), we get the number to fill in for 'expected loss' (50).
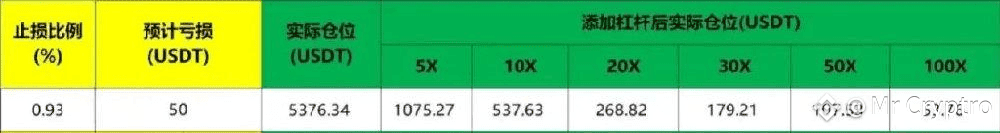
We will first use the 5-minute chart from Figure 9 as an example. Now we need to enter long at market price.
The stop loss ratio is 0.19, the take profit is 0.31, and the risk-reward ratio is 1.66.
Input the stop loss ratio as 0.19 and the expected loss as 50, which allows us to calculate that the actual position needs to open at 26315 USD, corresponding to the 'actual position' number. If trading contracts, leverage must be added; the data later will determine how much leverage to use, but my suggestion is still to use low leverage.
So how much can we earn? The opening price and take profit price (latest price) correspondingly fill in the opening price as 16494 and the latest price as 16546.
This means that when the market rises to 51.26 (Figure 9), the expected profit from this trade is 82.96 USD. Shorting is the opposite. Subtracting future fees gives the final actual profit.
Daily chart:
Input the stop loss ratio as 6.61, the opening price as 16444, and the latest price (take profit price) as 18254, resulting as shown in Figure 13.
No matter which cycle we are trading, as long as we control the position well, we can ensure the same risk and reward. Especially as a beginner, do not complicate the position; using this calculator is sufficient.
Of course, this calculator is for my own convenience and does not account for the issue of adding positions. Our old calculator can handle position additions.
Price action K-line analysis — trading within trading ranges (with illustrations)
If you often trade short-term, you will inevitably deal with trading ranges. Today we will analyze each K-line step by step to learn how to trade within trading ranges.
We take Ethereum's 15-minute chart as an example. The first thing is to look at the overall trend of the market, as shown in Figure 1.
We can see that the overall market presents a downward trend, indicating a significant bearish trend, and has just experienced a rapid decline. Next, we look at Figure 2.
From Figure 2, we can see that the first K-line that just emerged is a volumetric doji star. The appearance of a doji star during a decline doesn’t indicate much, but if it is a volumetric doji star, it may indicate an impending reversal (a point of volume-price analysis). From the perspective of volume-price analysis, the first K-line is a stopping behavior.
At this moment, we need to pay special attention; it does not mean that a reversal will occur immediately, nor does it mean that seeing K-line 1 allows us to 'bet everything.' At this moment, we need to closely monitor the market; this bearish trend may pause.
Next, we look at K-line 2 in Figure 3. K-line 2 is still a doji star with a long upper shadow. So does K-line 2 count as high 1?
Figure 3
The first K-line is a bullish signal K-line, and the second K-line is indeed high 1 because it breaks the high point. However, the second K-line is a non-trending K-line, not a bullish trend K-line.
A bullish signal K-line must be followed by a bullish trend K-line, so K-line 2 is an invalid high 1. According to price action, K-line 2 is not a good entry K-line, so we do not enter and continue to wait.
Next, we look at K-line 3 in Figure 4.
Figure 4
The K-line after K-line 3 also forms a high point breakout, but it is not an entry K-line and is invalid. Moreover, K-line 3 and the previous K-line do not constitute a bullish K-line.
Next, K-line 4 appears in Figure 5. K-line 4 is a strong bullish trend K-line, which engulfs the previous three bearish trend K-lines and is almost about to break the previous high point just rebounded from. Therefore, this K-line 4 is both a signal K-line and an entry K-line.
Figure 5
First, K-line 4 and the previous K-line form a bullish engulfing pattern. K-line 4's high point breaks the previous K-line's high point at a significant distance, so K-line 4 is both a signal K-line and an entry K-line.
If it is only treated as a signal K-line, it is also possible to be more cautious and wait for another bullish trend K-line as the entry K-line.
Next, we look at K-line 5 in Figure 6. Why does such a large bearish line appear at position 5?
Figure 6
Because the yellow line in the figure has consensus, smart money also knows that taking profits is at this position, so it is crucial to exit short-term profits. We are following the footsteps of smart money. Therefore, K-line 5 is the first signal to go short.
However, according to my trading habits, I would not enter here; I would wait for the second signal to appear.
Next, we look at Figure 7. Is the cross star after K-line 5 a low 1? Is it the entry K-line we expect?
Figure 7
Using naked K knowledge to interpret, it means that the bears continue to exert force and break through the low point of the previous bearish trend K-line (K-line 5), attempting to extend the bearish strength. However, it stopped after just this one K-line. Therefore, it is not a good entry K-line; it is not a bearish trend K-line.
Next, we look at K-line 6 in Figure 8. After K-line 6 appears, can we consider the decline from K-line 5 to K-line 6 as a simple retracement from K-line 4 to K-line 5?
Figure 8
It is possible, but caution is needed.
K-line 6 is a long signal K-line. Hanging an order here means waiting for an entry K-line. Moreover, take profits can only look at the previous high point; there is no space above, so take profits can only be seen at the high point of K-line 5. Only after it strongly breaks through K-line 5 can we see the next take profit line.
Next, we look at K-line 7 in Figure 9.
Figure 9
Now the decline from K-line 5 to K-line 7 is a two-part adjustment, creating lower lows. So can it be seen as a complex retracement from K-line 4 to K-line 5? Look at Figure 10.
Figure 10
K-line 7 is a short-term K-line and does not exceed 61.8%, so it can be considered a complex retracement. Next, we look at Figure 11.
Figure 11
K-line 7 combined with the following K-line tells us that this complex retracement has already finished, and now the entire trend 2.0 is about to start, ideally moving equidistantly.
Next, we look at K-line 8 in Figure 12. The rise from K-line 7 to K-line 8 is the 2.0 era of the trend from K-line 4 to K-line 5, but did this 2.0 era fail?
Figure 12
In fact, it is too early to say this. However, we can make a preliminary conclusion that it may have failed and needs further verification.
The smart money knows to take profits at the right positions, so there will certainly be a wave of supply, and it is inherently a significant bearish trend.
When we see K-line 9 in Figure 13, should we confirm that this trend 2.0 has failed?
Figure 13
It has indeed been confirmed that it has failed. In the structure from K-line 8 to K-line 9, K-line 8 is the first signal to go short, and K-line 9 is the second short signal.
If trading on the right side, it is safer to wait for another bearish trend K-line; for left-side trading, now is the time to enter at market price.
Logically, K-line 9 is both a bearish signal K-line and a bearish entry K-line.
If we are now going short, the stop loss and take profit should be placed at the positions in Figure 14.
Figure 14
Next, we look at K-line 10 in Figure 15. K-line 10 is similarly the first signal to go long.
Figure 15
Either hang an order to enter or wait for another appealing entry K-line.
Next, we look at K-line 11 in Figure 16. At K-line 11, there is a very good Pinbar, which is a bullish signal K-line that performs a false breakout of K-line 10. If we now close a high 2, can we enter the market? (Because this is the second occurrence of a bullish signal K-line, so it is high 2)
Figure 16
Similarly, left-side traders can now enter the market, while right-side traders wait for high 1 to appear. However, high 1 does not have a risk-reward ratio; both cannot be achieved, so it is a matter of personal choice.
So does K-line 12 in Figure 17 count as a new bullish signal K-line?
Figure 17
K-lines 10 and 11 are both bullish signal K-lines. K-line 10 is a morning star of the 12 golden K-lines, and K-line 11 is a Pinbar hammer line. K-line 12 is also at a critical white point, and now a new trading range has already formed.
The original trading range is the upper and lower bands, as shown in Figure 18.
Figure 18
Now at the middle track, a new trading range has been created, as shown in Figure 19.
Figure 19
Then we can only treat it according to the new trading range.
K-lines 11 and 12 form a segment on the small cycle in Figure 20.
Figure 20
Forming lower lows and lower highs. So we can count again.
Assuming we entered long at the Pinbar position of K-line 11, our take profit should be set at the position in Figure 21.
Figure 21
Of course, no matter where it is placed, there is a basis for it, but placing it here provides a very good risk-reward ratio, and combined, it has a mathematical advantage.
We see Figure 22. When the market reaches the white line position, supply appears, and many people take profits and exit. However, the demand side continues to exert force, raising prices. The bulls continue to exert force, and from a price action perspective, the three K-lines in Figure 22 represent a simple retracement or an FB structure.
Figure 22
The current market is back at the previous high, a crucial resistance level, and K-line 13 is the first signal to go short.
For safety's sake, we will not enter on the first opportunity, but will wait for the second entry opportunity, entering when we see a small double bottom or small double top.
Next, the market moves to Figure 23, where K-line 14 appears, which is once again a bearish signal K-line.
Figure 23
There were indeed low 1 or low 2 formations later, but it was not a very good bearish trend K-line. Moreover, a genuine breakout has already occurred, breaking through the pressure level of yellow line 1, so we need to find the next pressure level, which is the upper yellow line 2.
After K-line 15 in Figure 24 appears, it forms a dusk star with the previous one, creating the second opportunity to go short.
Figure 24
If a bearish trend K-line forms after K-line 15, we can confirm that the previous position was a genuine breakout, but K-line 15 is a false breakout of K-line 14.
K-lines 14 and 15 can form a small double bottom, which is eligible for entry. Therefore, our take profit should be set at the previous low, which is the position of the yellow line 1.
K-line 15 is also not the entry K-line we expect; it is a non-trending K-line.
In fact, the methods I use for K-line analysis are all content we have learned. The goal is not to let everyone enter the market according to what I say, but to understand why I analyze it this way, and to learn the thought process and analytical techniques.
Today, many terms mentioned in the text include (left-side trading and right-side trading), (simple retracement and complex retracement), (small double bottoms and small double tops), (volume-price analysis — volumetric doji stars), (12 golden K-lines — morning stars). To learn trading techniques, you need a lot of practical experience, but more importantly, you need to read books to find your own trading path, simplifying complex issues so that everyone can understand.
In trading, after strictly executing stop losses, how to deal with the problem of frequent stop losses?
The so-called 'strict entry and wide exit' simply means strict buying and lenient selling.
➤ Buying should be 'strict entry'
When entering the market, it is essential to comply with our trading system's entry rules, including trading direction, entry signals, entry stop losses, and profit targets, and to ensure that the entry is as logical and thorough as possible, with strict execution.
➤ Selling should be 'lenient'
Once the price deviates from the entry cost area and has a certain profit space, the selling conditions do not need to be too harsh, leaving normal price fluctuation space. As long as there is no obvious reversal trend, there is no need to panic and exit.
'Strict entry and wide exit' consists of two principles.
First principle: Try to protect our capital from loss.
Misjudging the trend direction, not entering according to signals, setting stop losses too small or too large, and frequent trading that does not comply with entry rules can easily lead to our trading failures, resulting in a loss of capital. Therefore, it is essential to discuss profits only after trying to preserve capital.
Second principle: Hold on to profitable trades as much as possible and let profits run.
The trend operates in a wave-like push, and price fluctuations need to breathe. Therefore, our stop losses do not need to be too tight; otherwise, we may get scared off by pullbacks or be stopped out, potentially missing trend movements.
The main difference between 'strict entry and wide exit' is reflected in the stop loss settings. Next, we will discuss the stop loss techniques of 'strict entry and wide exit'.
First, we divide 'strict entry and wide exit' into two phases:
First phase: 'Strict entry' phase.
Second phase: 'wide exit' phase.
'Strict entry' phase is our entry phase, requiring strict stop loss settings, while 'wide exit' phase is our trend-following and exit phase, requiring relatively relaxed stop loss settings.
In these two phases, four commonly used stop loss settings are:
1. Signal stop loss
2. Structural stop loss
3. Three-line stop loss
4. Break-even stop loss
Signal stop loss, based on the K-line shape of the trading signal.
Structural stop loss involves using key nodes of the price trend structure as stop loss points. These structural points are generally significant swing lows and swing highs in the trend.
Three-line stop loss, using the latest closing of the three K-lines, selecting the lowest price of the three K-lines as the stop loss for long positions or the highest price as the stop loss for short positions.
Since the trend structure is greater than the K-line shape, structural stop losses should be more reliable than signal stop losses and three-line stop losses. Therefore, in general, it is advisable to choose structural stop losses as our main entry stop loss.
Break-even stop loss, which involves moving the stop loss line to our opening entry point, so that the capital will not suffer losses. This stop loss method is generally chosen after the price has moved away from our cost zone and has a certain profit space.
Considering the characteristics of price trend operation, generally, in the latest price trend, K-line shapes should precede structural trends. So in the 'strict entry' phase, we can generally adopt signal stop losses and three-line stop losses, while in the 'wide exit' phase, we mainly use structural point stop losses.
So the question arises: how to distinguish whether the current price trend is in the 'strict entry' phase or the 'wide exit' phase?
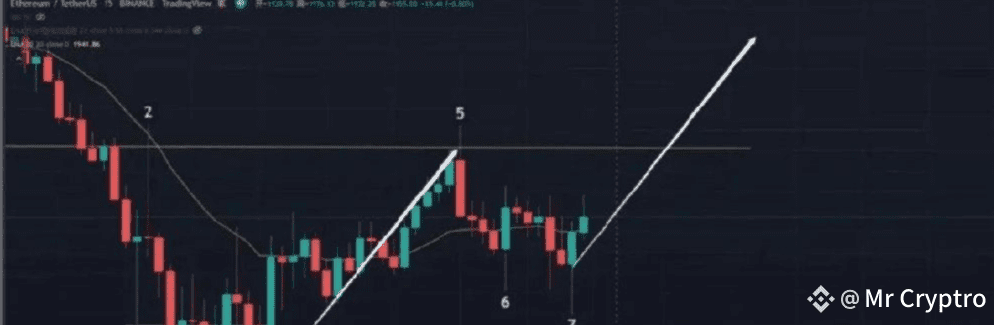
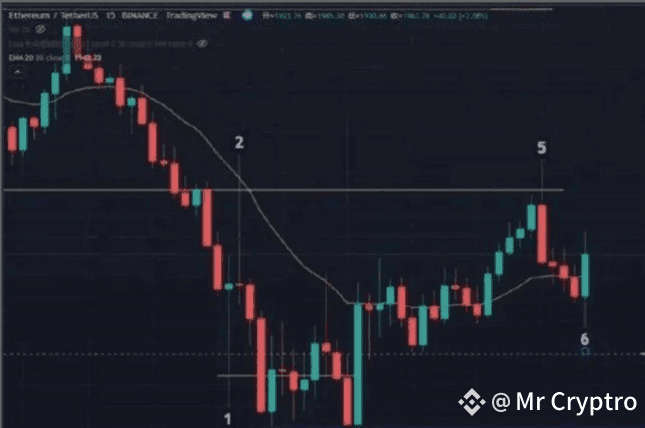
The 'strict entry' phase mainly refers to our entry phase. Assuming we are going long, we remain in the entry phase until the first latest structural low point is formed. Generally, when the price breaks the structural high point 2, the latest structural low point is established. The range from structural low point 1 to structural high point 2 belongs to the 'strict entry' phase, and the price breaking the structural high point 2 is classified into the 'wide exit' phase, indicating that structural high point 2 is a boundary point.
Next, we will deepen our understanding of the stop loss techniques of 'strict entry and wide exit' through case reviews.
For a bullish engulfing line signal, entering long, the entry stop loss can be placed below the signal's lowest point. Since structural low point 1 is close to the signal, we can choose below structural low point 1 as the entry stop loss, which is the best choice.
When the price reaches K3, it has already deviated from our opening cost area and has a certain profit space. We will consider moving the stop loss to the opening point or adopting the three-line stop loss, moving the stop loss line below the lowest price of K1. Such a stop loss would be relatively aggressive and may easily lead to being stopped out, missing the existing trend in the future. However, in the 'strict entry' phase, our goal is to protect our capital as much as possible.
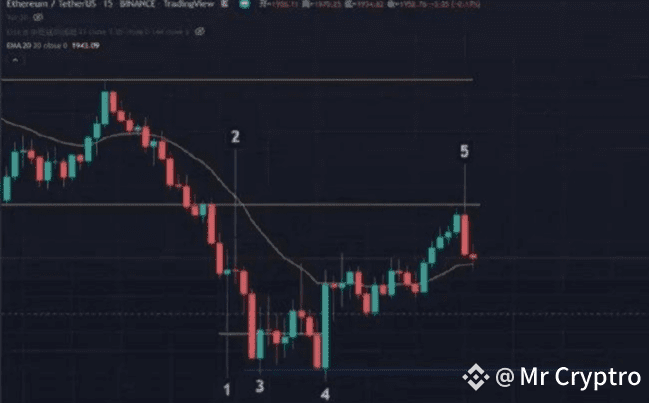
Structural high point 2 is the boundary between the 'strict entry' phase and the 'wide exit' phase. When the price breaks structural high point 2, establishing structural low point 1, this is the first latest structural low formed after entering the market. The price enters the 'wide exit' phase, and we move the stop loss to structural low point 3. Although the price has dropped from structural high point 3, just touching our stop loss point to exit is a normal price behavior, and there is no need to regret it. Subsequently, the bullish engulfing signal at structural low point 4 can be used to re-enter long.
A bullish engulfing line signals to enter long. The entry stop loss is close to the signal, so we adopt the relatively conservative structural low point 1 as the entry stop loss.
When the price reaches K3, it has already deviated from our entry cost area and has a certain profit space. At this time, move the stop loss to the opening point to protect our capital, or adopt the three-line stop loss method to move below the lowest price of K1, which can protect our capital from loss while locking in some profit space.
It should be noted that when using the three-line stop loss method: if the latest three K-lines are only composed of narrow small bearish, bullish, and doji lines, there is no need to use these three K-lines as stop losses, as they can easily lead to being stopped out. Ideally, at least one of the three K-lines should have a certain amplitude and the trading direction should be opposite.
Structural high point 2 is broken, establishing the first latest structural low point 3 after entering the market. At this time, the price also enters the 'wide exit' phase, and we can move the stop loss below the structural low point 3.
After moving the stop loss to structural low point 3, we protect our capital and lock in some profit space; future market trends will simply be a matter of earning more or less, so there is no need to closely follow the price trend for stop loss operations; we only need to track and observe the price trend, judging whether the trend is reversing or whether we need to reduce positions and take profits to exit.
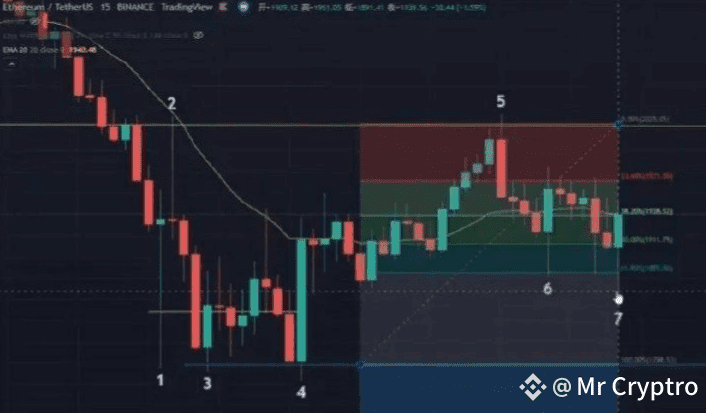
The reduction of positions, profit-taking, and exit during the 'wide exit' phase mainly focus on key reversal structure points and strong reversal signals. During the wide exit phase, if we move the stop loss closely following the structural low points, we can easily get stopped out because, as we approach higher levels or consolidation zones, prices are more likely to break the latest structural low, leading to passive profit-taking exits. Therefore, keeping the stop loss at important structural lows that are not easily touched by price is advisable.
Returning to the gold case review, high point 4 did not break high point 3, possibly forming a small M-top. The key level of the low point 4 small M-top’s neck line is considered a secondary structural low point due to the small amplitude of the range. When the price breaks below low point 4, we can consider manually reducing positions or taking profits to exit. The price drops to low point 5 but still does not touch our stop loss at low point 3, so if we still have a position, we can continue to observe the price trend. High point 5 tests the resistance levels of high points 3 and 4 but does not break, merely forming a long shadow hammer line, which is a strong bearish reversal signal, indicating a signal to exit and take profit.
In conclusion, the trading philosophy of 'strict entry and wide exit' means that the stop loss used in the entry phase will be relatively aggressive and somewhat violate normal price fluctuation rules, but the purpose is to ensure the safety of capital as much as possible. The stop loss strategy in the exit phase transforms, which is actually an operation that follows the normal rhythm of price fluctuations, allowing for better capture of trend movements.
The 80/20 rule in the cryptocurrency market: How to become one of the few who make money?
In the cryptocurrency market, there is a well-known '80/20 rule'. This rule tells us that in any group of things, the most important only accounts for a small part, about 20%, while the remaining 80%, although the majority, is secondary. In the investment field, this rule is vividly reflected: 20% of investors make money, while 80% lose money. So, how to become one of the 20% who make money in the turbulent cryptocurrency market?
First, you need to have a deep understanding of the market. The cryptocurrency market is different from traditional investment fields; its volatility and uncertainty are greater, requiring investors to have higher risk tolerance and sharper market insight. Before entering the market, you need to have an in-depth understanding of blockchain technology, the issuance mechanism of digital currencies, market trends, and so on. Only when you have a comprehensive understanding of the market can you maintain calm during market fluctuations and make rational decisions.
Secondly, having a unique investment strategy is essential. The volatility of the cryptocurrency market provides investors with tremendous opportunities but also comes with significant risks. To become one of the few who make money, you need to have a unique investment strategy and not blindly follow trends or believe in rumors. You can develop your investment strategy by observing market sentiment, analyzing project value, and tracking capital flows.
Moreover, it is crucial to have steadfast investment beliefs. In the cryptocurrency market, investors often face various temptations and challenges, such as greed during market surges and fear during market crashes. These emotions can often interfere with your investment decisions, leading to incorrect judgments. Therefore, you need to have steadfast investment beliefs, trust your investment strategy, and not be easily swayed by market emotions.
Finally, continue to learn and accumulate experience. The cryptocurrency market is unpredictable, with new projects and technologies emerging continuously. To establish yourself in this market, you need to maintain a continuous learning attitude and keep accumulating experience. You can improve your investment capabilities and cognitive levels by reading relevant books, participating in online courses, and keeping up with industry trends.
In summary, to become one of the profitable few in the cryptocurrency market, you need to have a deep understanding of the market, develop unique investment strategies, maintain steadfast investment beliefs, and continuously learn and accumulate experience. Only in this way can you remain undefeated in the cryptocurrency market and become one of the 20% who make money.
However, it is important to remind that investing carries risks, and caution is needed when entering the market. While pursuing wealth, we must also remain rational and not blindly seek high returns while ignoring potential risks. After all, only steady investments can bring long-term profits.
Even the most diligent fisherman does not go out to sea to fish during stormy weather but carefully guards his boat. This season will pass, and a sunny day will come! Follow me, and I will teach you how to fish and fish itself; the cryptocurrency world is always open. Only by following the trend can you have a life that follows the trend. Save this and keep it in mind!

#币安HODLer空投PLUME #比特币 #加密货币


