Bearish Patterns
(Indicate possible price drop or reversal from an uptrend)
1. Hanging Man
Small body, long lower wick. Appears after an uptrend → signals weakness.
2. Shooting Star
Small body, long upper wick. Appears after an uptrend → signals exhaustion.
3. Gravestone Doji
Open, low, and close at same price; long upper wick. Sellers take control.
4. Bearish Engulfing
Big red candle completely engulfs small green candle → trend reversal to bearish.
5. Dark Cloud Cover
Green candle followed by a red candle closing halfway into the green → bearish pressure.
6. Bearish Harami
Large green candle followed by a small red inside it → weakening trend.
7. Evening Star
Green candle → small Doji → big red candle. Strong reversal signal.
---
📈 Bullish Patterns
(Indicate possible price rise or reversal from a downtrend)
1. Hammer
Small body, long lower wick. Appears after a downtrend → signals reversal upward.
2. Inverted Hammer
Small body, long upper wick. Appears after a downtrend → possible reversal.
3. Dragonfly Doji
Open, high, and close at same price; long lower wick → buyers regain control.
4. Bullish Engulfing
Big green candle completely engulfs small red candle → trend reversal to bullish.
5. Piercing Pattern
Red candle followed by green candle closing halfway into the red → bullish pressure.
6. Bullish Harami
Large red candle followed by a small green inside it → weakening bearish trend.
7. Morning Star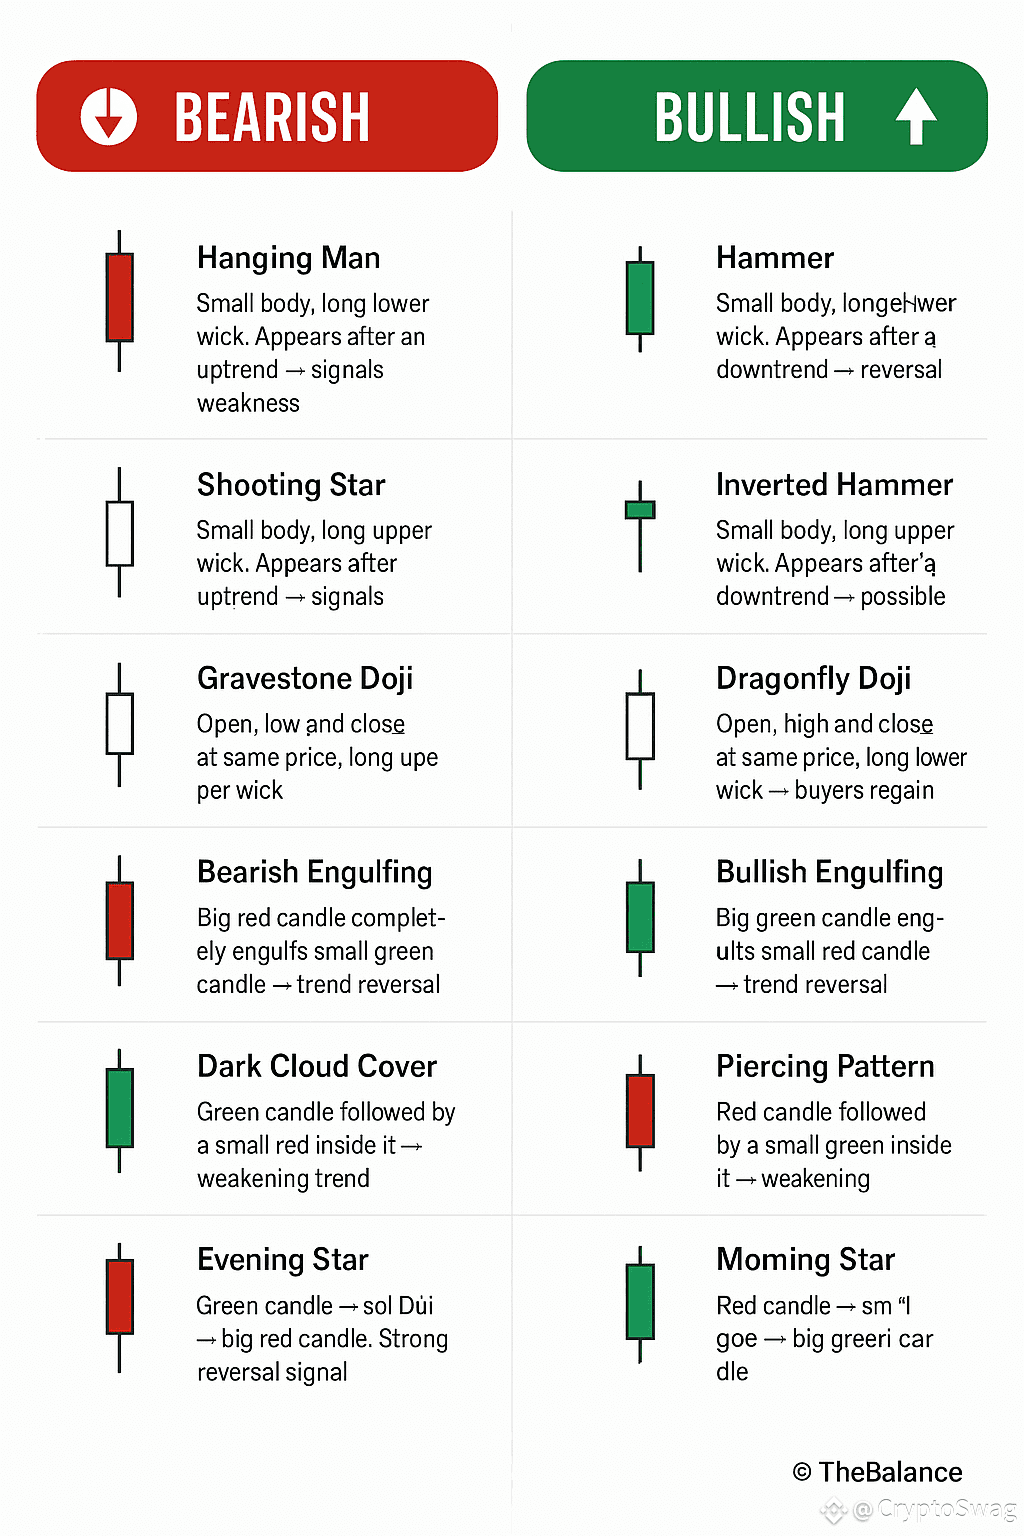
Red candle → small Doji → big green candle. Strong reversal signal.