🟢 Current Status (3D)
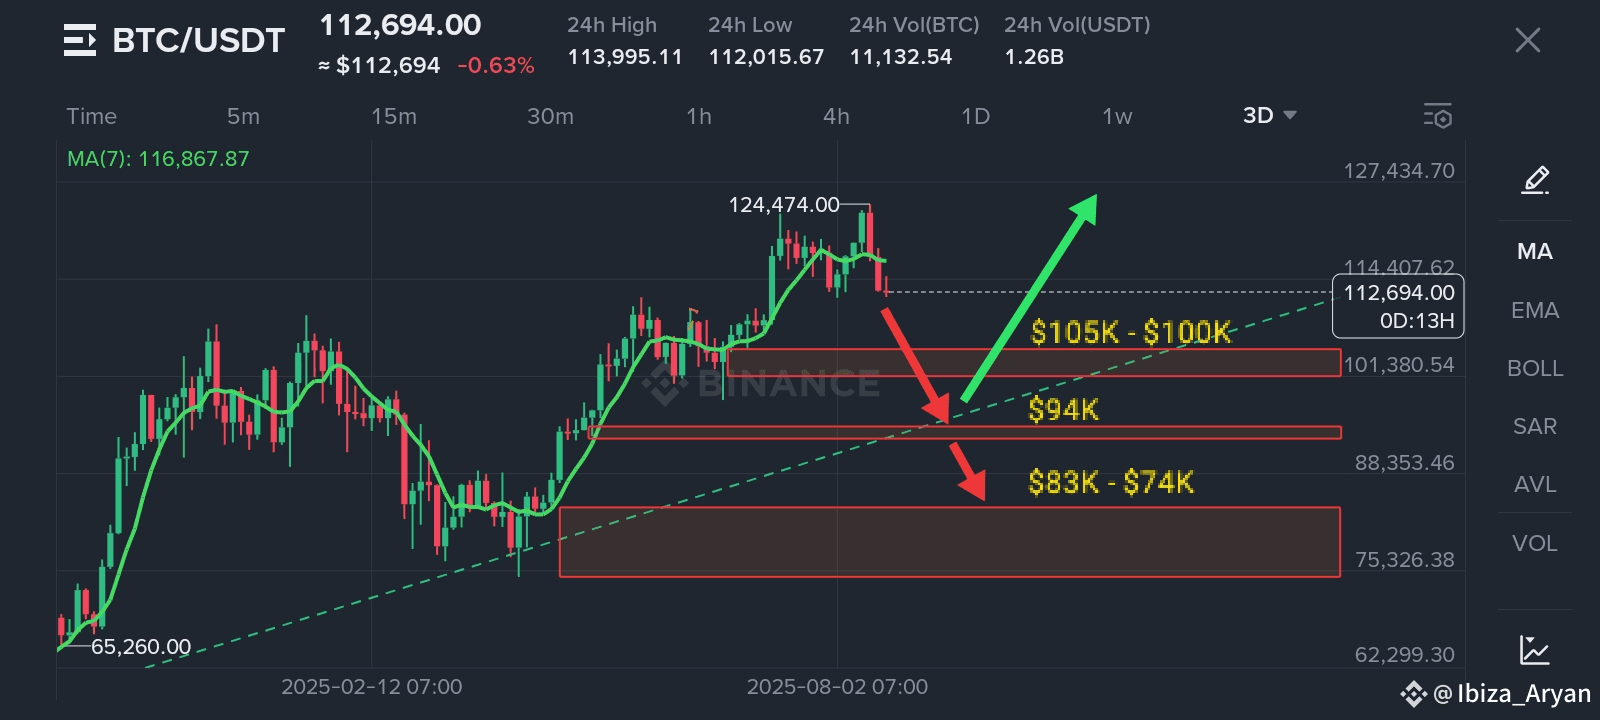
• Local Top: $124,474
• RSI (6): 38 → Cooling, not oversold yet.
• MACD: Bearish crossover → momentum fading.
---
📈 Structure:
BTC blasted from $74K to $124K in a straight sprint. Now it’s gasping for air. The 3D chart shows price hanging around $113K, testing supports. The $100K level is the real battleground — hold it, and bulls can breathe. Lose it, and gravity takes over.
🔑 Key Levels (3D):
Resistance: $124K – $128K → Ceiling of pain. Support Zones:
• $105K – $100K → First demand area.
• $94K → Mid-term checkpoint.
• $83K – $74K → Full reset, long-term floor.
---
🧭 Scenarios:
✅ Bullish: Hold $100K, reclaim $124K → push to $140K – $150K.
❌ Bearish: Slip under $100K → fall to $94K → $83K → maybe $74K reset.
---
📊 Playbook for Traders
Buy zones:
• Aggressive: $105K – $100K
• Safer: $94K – $83K
• Long-term: $74K
• Take profit zones: $124K – $128K / partial exits above $140K.
⚠️ Mindset: Don’t FOMO into green candles. The big moves take patience.
📌 Summary (No Copium):
BTC’s parabolic run has cooled. The $100K level is make-or-break. Hold it, and the bulls get another chance. Lose it, and we’re likely heading back to $94K or even $83K. Wide trading range: $74K – $128K.