Throughout my years of trading cryptocurrencies, I've experienced significant ups and downs, transitioning from debt to financial freedom, a leap in class. During this time, I've made profits and incurred losses, engaging in everything from meme coins to ICOs and mining, encountering countless pitfalls. It’s said to be a game of bull and bear, but it feels more like managing emotions — with surprises and disappointments. It’s a magical circle, a captivating place where I have summarized countless operational methods and strategies. Ultimately, the only profitable method is simple, straightforward: buy in a bear market, sell in a bull market, and be assured of profits.
In the crypto space, many newcomers may not know how to read candlestick charts, and those who do understand are few and far between. As the saying goes, 'master one skill and conquer all'. It's not hard to master a technical analysis you can understand, the difficulty lies in the unwillingness to learn. Trading cryptocurrencies is not for others, but for oneself. If you’re willing to put in the effort, learn it well, and grasp it thoroughly, then trading cryptocurrencies won’t be as difficult as you think.
Before discussing technical strategies, I strictly adhere to the following eight rules of war:
First, let’s say, if you have 100 contracts, and 30 are losing, then these 30 losing contracts will definitely be unevenly distributed. It's normal to lose three or five in a row, so keep your cool. Don’t let the losses from one trade affect your next decision. If you make a mistake, acknowledge it and correct it. No one in the crypto space can be 100% accurate, so making mistakes is not embarrassing.
Second, don't waste bullets; always remember the old saying: prioritize survival and risk management. Shift from wanting to make quick large profits to protecting your capital first. You can imagine having a gun; you should only take a shot when the target presents itself. Therefore, learn to wait. Mastering patience can help you surpass over 90% of people in the crypto space.
Third, the more favorable conditions we have when opening positions, the better; whether it's a pattern or an indicator, if multiple time frames align in the same direction, the more conditions we satisfy, the greater our odds of success and survival. Thus, most of our time is spent waiting. Don’t just walk around with a gun aiming randomly; do you have the patience to wait as those in the crypto space do?
Fourth, always remember the old saying: abandon any market that makes you hesitate. Shift from wanting to seize every opportunity for fear of missing out to seeking only those that fit your trading model. Abandon trades where the profit-to-risk ratio is not favorable to avoid meaningless trading. As I have said, most opportunities in the market are traps.
Fifth, we need self-control and self-discipline. Experts in the crypto space often say that each of us is a trader. So when we operate, we must think from a different angle. Genius traders must approach trading rationally, rather than acting on instinct. Many in the market chase prices based on feelings driven by greed and fear. Once your emotions fluctuate too wildly, your trading will become distorted. Therefore, it is essential to remain calm and think rationally.
Sixth, avoid adding positions rashly, especially when you are losing. Increasing your position size will only increase your risk. Just like the reasoning behind the stop-loss exit for the Bitcoin trade provided by Teacher Qing Tian the other day, if the timing for reallocating is wrong, and the timing for entering is wrong, the final outcome will be a stop-loss exit. These are bloody lessons. Similarly, don’t expand your stop-loss distance excessively in pursuit of a higher win rate out of fear of making mistakes. Making mistakes is normal; just follow your trading rules.
Seventh, avoid over-watching and being overly tense. Most newcomers in this market struggle with their mindset and can easily be affected by market fluctuations. Some even lose sleep over their positions, constantly thinking about their trades. Once you place an order, whether for a take-profit or stop-loss, try to reduce your focus on the candlesticks, as large bullish or bearish candles during fluctuations can easily trigger your emotions, potentially leading to premature trade exits, especially when profitable. If you really want to monitor the market closely, focus more on numerical quotes. Teacher Qing Tian always tells you the trend of the order book before each trade, where the take-profit and stop-loss levels are, and how many steps to enter; just strictly follow the trading rules I provide, and over time, you will naturally develop your own trading system.
Eighth, trading is not everything in life; you still need to work and live. After suffering a loss, I once became anxious to recover it. It was like sand; the tighter you grip, the more it slips away. So, first survive; we can only continue trading if we stay alive. I often say my advice might not make everyone rich overnight, but what I can do is ensure that according to the sunny day trading system, you will always be in the game. Keep going, and I hope we can walk to the end together.
So how can we do well in trading cryptocurrencies? Once a person enters the financial market, it's hard to turn back. If you're currently losing and still feeling confused, but plan to treat trading cryptocurrencies as a second career, you must know the 'simplest 15-minute trading techniques'. Understanding and grasping them can save you a lot of detours; these are personal experiences and feelings, so I suggest you bookmark them and reflect on them repeatedly!
In forex, futures, and other trading, an ideal 15-minute trading strategy involves applying technical indicators such as moving averages, Bollinger Bands, and the Relative Strength Index (RSI) in conjunction with robust risk management techniques. Effectively using these tools helps us find accurate entry and exit points, which is especially critical for short-term trading styles.
The key to this strategy lies in executing strict stop-loss orders and adjusting position sizes based on current market volatility.
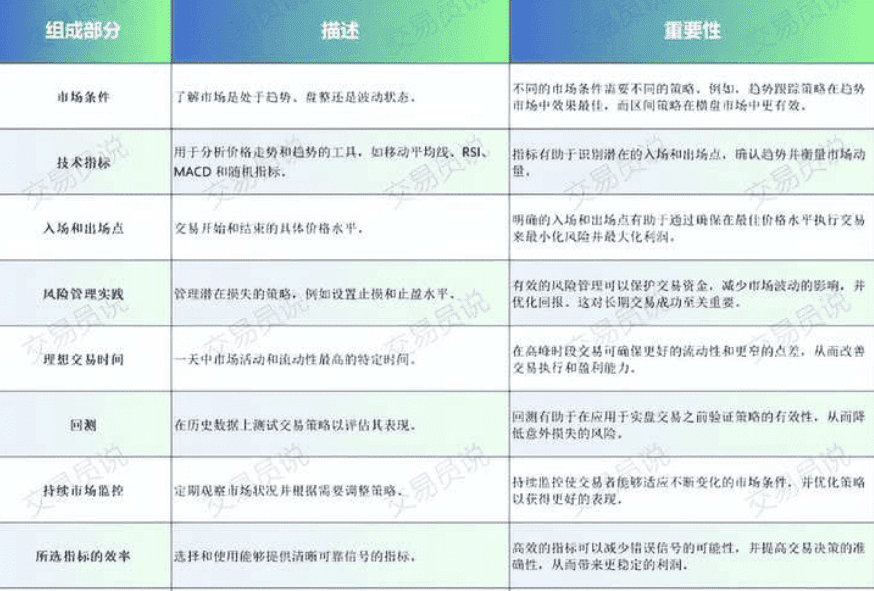
Key components of a 15-minute trading strategy
A successful 15-minute trading strategy depends on multiple key factors, including market conditions, precise technical indicators, clear entry and exit points, strict risk management measures, ideal trading timing, rigorous backtesting, continuous market monitoring, and the efficiency of the chosen indicators.
Using relatively tight stop-loss and customized take-profit levels is essential. For example, a typical recommendation might be to set a 10-point stop-loss paired with a 20-point take-profit, effectively protecting traders from significant capital losses while locking in potential gains.
Adjusting position sizes based on volatility and current market conditions can strengthen this protective framework, ensuring that each trade is proportional to the assessed risk (a 2:1 reward-to-risk ratio).
Effective technical indicators for 15-minute trading
Due to their responsiveness and accuracy, several tools stand out in assessing the effectiveness of the 15-minute trading cycle technical indicators. Moving averages and Bollinger Bands provide detailed information about market trends and volatility, making them very useful in short-term trading analysis.
The Relative Strength Index (RSI), Parabolic SAR, and Average Directional Index (ADX) assist in identifying potential reversal points and maintaining market momentum, thereby enhancing your trading decisions.
Moving Averages
Using moving averages, particularly the 5-day and 10-day moving averages, can simplify trend analysis and help identify market fluctuations on a 15-minute trading chart. These short-term moving averages are often used when executing momentum trading strategies, focusing on capturing rapid market movements triggered by currency pair volatility.
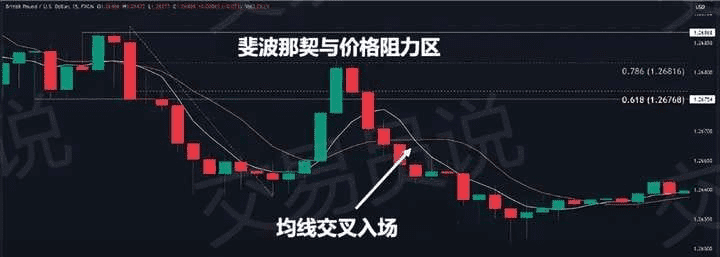
The moving average crossover technique is a key aspect of this method. When the 5-day moving average crosses above the 10-day moving average, it indicates a potential buying opportunity; conversely, it's a sell signal.
These moving averages also help traders identify support and resistance levels, which are crucial for trend-following strategies within this compressed time frame. By understanding the positioning of these levels, traders can better predict potential reversals or trend continuations, thus improving decision-making precision.
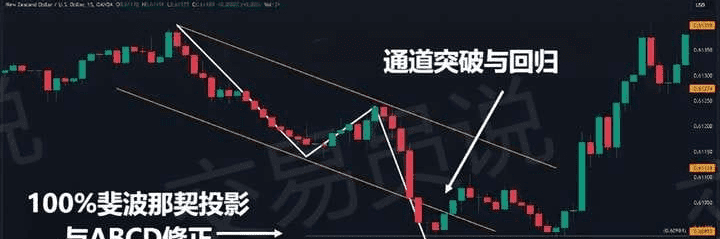
Combining Fibonacci retracement with moving averages provides another framework for price action analysis. Through this combination, traders can identify significant price points and adjust their strategies, ensuring alignment with the micro-fluctuations and overall trends displayed on the 15-minute chart.
Relative Strength Index (RSI)
The Relative Strength Index (RSI) is used to identify overbought and oversold conditions in 15-minute trading strategies. This momentum oscillator measures the speed and change of price movements, with values ranging from 0 to 100.
Typically, an RSI below 30 indicates an oversold condition, suggesting a potential buying opportunity, while above 70 indicates an overbought condition, signaling a possible sell-off. Traders often use these thresholds to predict reversals when the market reassesses prices.
The RSI also provides signals for trend confirmation. When the RSI aligns with the current price trend, it confirms the current momentum, allowing traders to strengthen their positions accordingly. For example, in a bull market, an RSI above 50 supports the continuation of an upward trend. In a bear market or when prices are falling, an RSI below 50 can confirm a downtrend.
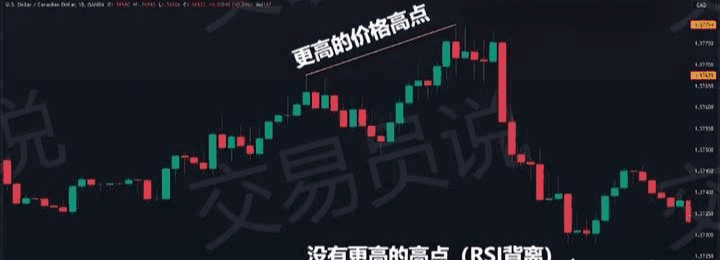
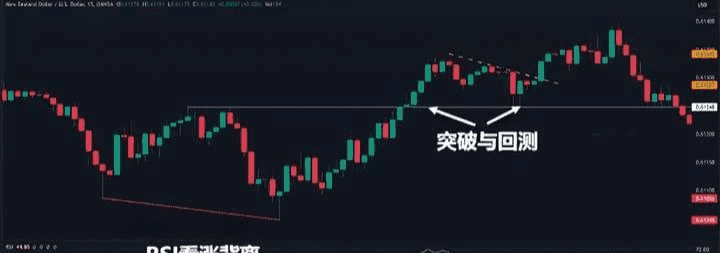
RSI divergence plays an important role in identifying changes in market dynamics. When the RSI diverges from the corresponding price trend — that is, when prices make new highs or lows but the RSI does not — this often indicates a weakening trend and may signal a reversal.
This inconsistency between price and RSI can be a powerful signal, prompting a reevaluation of positions and thereby enhancing the effectiveness of short-term trading strategies.
Bollinger Bands
Bollinger Bands can help traders assess market volatility and identify potential breakout points in a 15-minute trading strategy. By placing price movements within dynamic 'envelopes', these indicators adjust based on recent price fluctuations, making them very suitable for the fast-paced decision-making required in a 15-minute time frame.
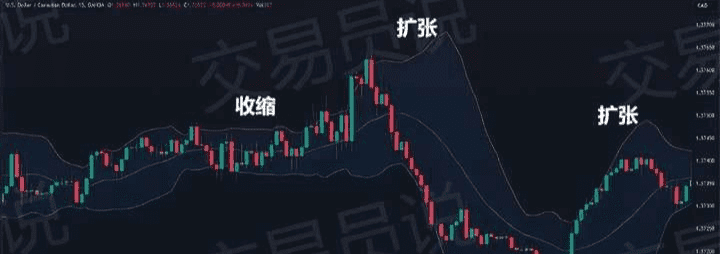
Bollinger Band squeeze (contraction): When Bollinger Bands tighten around prices, it indicates reduced volatility and often signals significant price movements. Traders watch for breakouts following squeezes as signals to enter trades.
Breakouts and reversals: Price breaking through bands can indicate impending reversals or trend continuations, which are crucial for quick profits in 15-minute charts.
Bollinger Band width: This indicator helps quantify market volatility. A narrowing width indicates a potential squeeze, while an expanding width suggests increased volatility.
Touchpoints: When price touches the lower or upper band, it can serve as a key trading signal indicating overbought or oversold conditions.
Each of the aspects mentioned above ensures that Bollinger Bands are an effective part of short-term time frames (especially during squeezes), providing insights into market dynamics (especially during consolidations).
Parabolic SAR
Another effective technical indicator for 15-minute trading strategies is the Parabolic SAR, which performs excellently in setting trailing stop losses and exit timings. This indicator is known for its ability to provide clear exit signals, enhancing the risk management techniques of short-term traders.
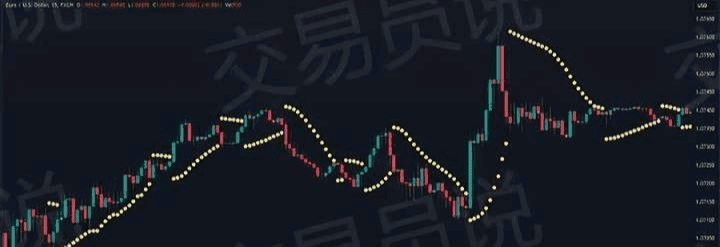
When analyzing the Parabolic SAR strategy, backtesting results show that this indicator performs well in trending markets. Traders often use it to set stop-loss levels, effectively protecting profits or preventing significant losses. By adjusting the acceleration factor, traders can fine-tune the indicator's sensitivity to align it with their trading strategy.
When comparing the Parabolic SAR to other indicators, its effectiveness is reflected in its simplicity and direct visual representation on charts. Unlike more complex indicators, the Parabolic SAR provides straightforward, actionable information without requiring extensive explanation, which is crucial in the fast-paced 15-minute trading window.
Average Directional Index (ADX)
The Average Directional Index (ADX) is crucial for quantifying trend strength and identifying current market trends. Traders rely on the ADX to show the strength of the trend. Interpreting the ADX is important across various market conditions, as it provides a clear perspective on whether the trend is strengthening or weakening.
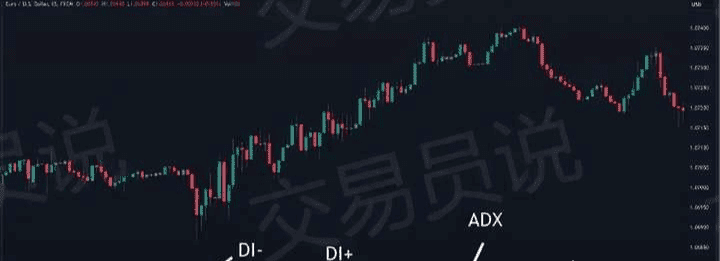
In the 15-minute time frame, the ADX provides important information:
Trend confirmation: An ADX value above 25 indicates a strong trend, laying a solid foundation for trend-following strategies. This level of trend strength is crucial for confirming potential entry signals.
Detecting a weakening trend: A declining ADX value indicates a weakening trend, alerting traders that market conditions may change or that they should proceed with caution. #Federal Reserve June meeting minutes
ADX crossover: When +DI (positive directional indicator) and -DI (negative directional indicator) cross, it may signal a trend reversal, guiding traders on when to exit or enter opposite positions.
Filtering market noise: By distinguishing between trending markets and range-bound markets, the ADX helps filter out trading setups with lower profit potential, focusing on those with a higher probability of success.
For further understanding of the ADX indicator, please read: (Is it a tool for identifying trends and increasing win rates? Learn how to use the ADX indicator to accurately judge market trends)
Stochastic Oscillator
Based on the Average Directional Index, the Stochastic Oscillator can also serve as a tool for identifying overbought and oversold conditions in 15-minute trading. This indicator is particularly suitable for short-term traders looking to capitalize on rapid market fluctuations.
The Stochastic Oscillator involves two lines: %K, which measures the current price relative to the highest and lowest prices over a specified period; and %D, which is the moving average of %K. When %K breaks above %D in the oversold zone (below 20), it usually indicates a potential buying opportunity. Conversely, when %K breaks below %D in the overbought zone (above 80), it typically signals a selling opportunity.
The settings for the Stochastic Oscillator are adjustable; however, on a 15-minute chart, traders typically use a %K of 14 periods and a %D of 3 periods. These settings help smooth the output of the indicator, making signals clearer, especially in short-term trading where frequent price fluctuations can easily disrupt signals.
Identifying divergences in the Stochastic Oscillator can enhance trading accuracy. When prices form new highs or lows without corresponding changes in the Stochastic Oscillator, divergences occur, suggesting potential price reversals. Divergences can serve as clues indicating possible strength changes in price movements that may not be apparent in pure price action.
SuperTrend (Super Trend Indicator)
In 15-minute trading, another important indicator is the SuperTrend, which effectively identifies trend direction and sets ideal stop-loss levels. The advantage of SuperTrend lies in its simplicity and clarity, accurately signaling bullish or bearish market sentiment.
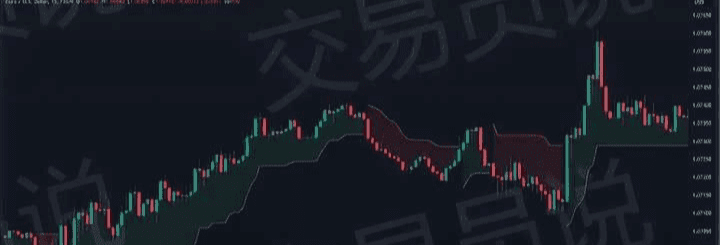
SuperTrend combines price volatility and the Average True Range (ATR) factor to determine the position of trend lines. This helps traders make informed decisions quickly based on current market conditions, especially suitable for short-term trading like the 15-minute charts.
When configuring SuperTrend settings, traders typically adjust the ATR multiplier and period to suit the volatility and price dynamics of the traded asset. Adjusting these settings is crucial for improving the indicator's sensitivity to price fluctuations, thereby enhancing the accuracy of trend predictions and the effectiveness of stop-loss orders.
Identifying entry and exit points
Identifying precise entry and exit points on a 15-minute forex chart requires using technical indicators and chart patterns to quickly capture short-term price fluctuations. Traders must analyze various trading indicators and patterns to make informed decisions quickly.
Here are important tools and concepts for determining entry and exit points:
Candlestick patterns: Use common 15-minute candlestick patterns, such as engulfing patterns, hammer lines, or shooting star lines. These patterns can indicate potential reversals or trend continuations, providing clear signals for entry or exit.
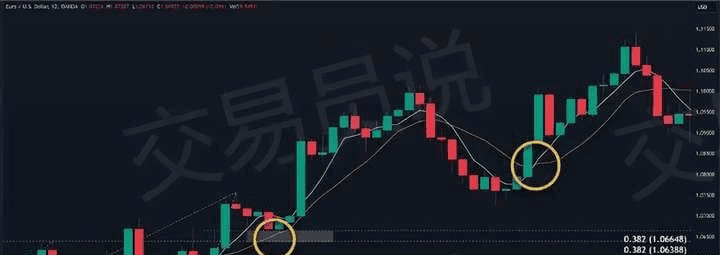
Fibonacci retracement: Apply Fibonacci retracement levels to identify potential reversal points in the short term. These retracement levels often serve as support or resistance, where prices may stop or reverse, making them very important in rapid trading.
Support and resistance levels: Strong support and resistance levels are crucial in 15-minute trading. They provide areas where prices may pause or reverse. Identifying these levels helps formulate entry plans for breakouts or bounces and set precise stop-loss or take-profit points.
Three common 15-minute forex trading strategies
Due to their effectiveness and adaptability, several strategies are widely used.
The opening range breakout strategy capitalizes on early market volatility to establish profitable positions.
Conversely, the breakout retest strategy and trading bullish flags offer methods to identify and capitalize on patterns for potential gains within this short time frame.
Forex opening range breakout strategy
The opening range breakout strategy capitalizes on the volatility of the first 15-minute candlestick of a currency pair after the London session opens, profiting by setting trades at its high and low points. This method takes advantage of the initial price fluctuations often observed during the most popular forex trading hours.
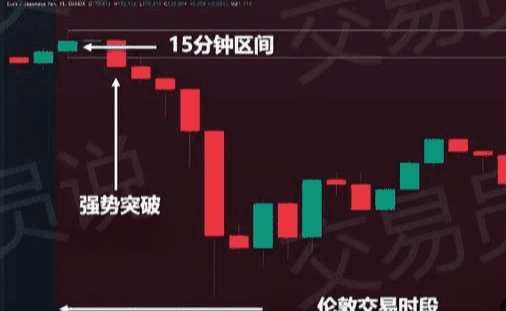
By focusing on price action during this time frame, traders can see potential directional trends based on the strength of the market after opening and the market trend.
Visualizing candlestick charts: The first 15-minute candlestick is crucial; its upper and lower shadows represent potential breakout points.
Market entry: Traders set buy orders above the high point of the candlestick and sell orders below its low point, aiming to capture rapid fluctuations.
Volatility analysis: Assessing the size and shape of the opening candlestick can provide insights into early market sentiment and potential volatility.
Trend identification: Successful breakouts can confirm or establish the direction of the trend, guiding subsequent trading decisions.
The opening range breakout forex strategy utilizes candlestick patterns to identify trading opportunities, ensuring that traders align with the market's initial momentum by observing price action and market volatility.
Breakout retest strategy
While the opening range breakout strategy utilizes early market volatility, the breakout and retest strategy focuses on capturing price movements after retesting key support or resistance levels. This currency trading method is based on the principle that once a key level is broken, the price is likely to retest that level before continuing the trend.
Traders using this method will observe breakout patterns on higher time frames (such as 1-hour or 4-hour charts) to determine the relevant support or resistance levels for currency pairs.
Once these levels are identified, the strategy will shift to the 15-minute chart, focusing on retest rebounds. The core of this strategy is to enter trades during these rebounds, taking advantage of frequent small fluctuations that occur when prices retest previously broken levels. This method not only aids in trend identification but also improves the accuracy of entry and exit points when trading major currency pairs.
The execution method for the breakout retest strategy is as follows: identify breakouts, wait for a retest, and then execute the trade after confirming the trend continuation on the 15-minute chart. This method aims to maximize profits from short-term fluctuations in currencies, making it an effective strategy for day traders to take structured advantage of rapid rebounds.
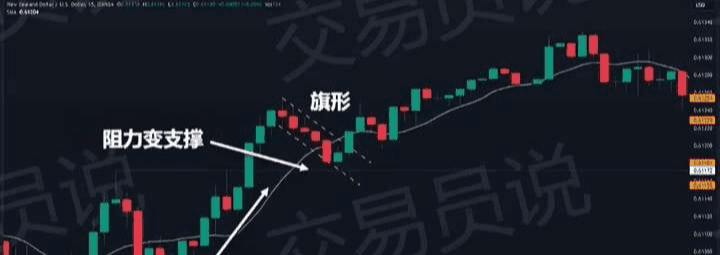
Trading bullish flags
Among various 15-minute trading strategies, trading bullish flags stands out for its efficiency in capitalizing on price uptrends after a consolidation period. This method exploits the formation of the 'bull flag' pattern, characterized by a sharp price rise followed by a brief period of sideways or downward consolidation, resembling a flag on a pole.
To effectively use bullish flags in a 15-minute trading window, traders should focus on the following key elements:
Flag pattern analysis: It is crucial to carefully examine flag structures. True bullish flags usually display a sharp rise in the flagpole, followed by a rectangular flag that consolidates downward or sideways with no significant change in volume.
Volume confirmation: Successful trading of bullish flags requires validation through volume analysis. Ideally, a breakout is accompanied by increased volume, confirming the strength of the pattern and the likelihood of trend continuation.
Pattern reliability: Historical data should be evaluated to understand the reliability of flag patterns under similar market conditions.
Entry and exit points: Accurately identifying entry points during flag breakouts and strategic exit points to maximize profits is crucial.
Risk management in 15-minute trading
In 15-minute trading, effective risk management depends on implementing precise stop-loss and take-profit orders to protect capital and maximize profits. It's also important to adopt a disciplined position-sizing management approach.
By adhering to the 1% rule (especially as a beginner), traders ensure that the risk of a single trade does not exceed 1% of their total trading capital, thus maintaining a manageable risk exposure amid market fluctuations.
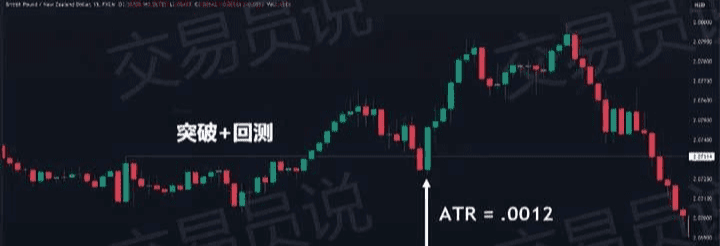
Technical indicators such as the Average True Range (ATR) can be used to align stop-loss orders with current market volatility. This method helps to accommodate normal price fluctuations without exiting positions too early.
Setting stop-loss orders just outside key support and resistance levels can provide enough room for trades while still preventing significant losses.
Trading psychology cannot be ignored. Maintaining emotional discipline by sticking to pre-set stop-loss and take-profit points helps mitigate the impact of emotional trading decisions, which can often be very strong in short-term trading scenarios.
Regularly reviewing and adjusting these orders based on changing market conditions is crucial for effectively responding to market volatility and protecting trades from sudden shifts in market sentiment.
Backtesting and optimizing trading strategies
Backtesting 15-minute trading strategies requires a methodology to verify their effectiveness and adaptability under different market conditions. Analyzing historical data for risk assessment and performance analysis is crucial for optimizing strategies and enhancing their potential profitability.
Here are best practice guidelines for backtesting and optimizing such strategies:
Use sufficient historical data: Ensure the data covers various market conditions, including trends, volatility, and consolidation periods. This diversity tests the robustness and adaptability of the strategy.
Incorporate real trading conditions: Consider slippage, commissions, spreads, and execution delays to simulate actual market conditions. This step is crucial for accurate performance analysis.
Conduct advanced statistical analysis: Use techniques such as measuring standard error to understand the uncertainties and risks associated with strategies. Additionally, calculate the expected value of the strategy to predict potential profitability.
Conduct forward-looking analyses and continuous optimizations: After initial backtesting, apply the strategy to new, unseen data segments to check consistency. Continuously optimize and adjust parameters to avoid overfitting and adapt to changing market dynamics.
These practices ensure that strategies can withstand historical testing and have potential in real-time trading scenarios.
Conclusion
Effective 15-minute trading strategies require the use of technical indicators, identifying entry and exit points, and strict risk management.
Common strategies designed for this time frame should be backtested to improve their efficiency and accuracy. You need to be very familiar with your strategies.
Sticking to these principles can enhance your potential for success in the fast-paced 15-minute trading environment, optimizing the decision-making process and improving the trading results of your positions.
I am Wenhua, a professional analyst and teacher, a mentor and friend on your investment journey! As an analyst, the most fundamental thing is to help everyone make money. To resolve your confusion and open positions, let my strength speak for itself. When you feel lost and don’t know what to do, follow me, and Wenhua will guide you.
Continuous attention:$BTC $ETH $XRP
#名人MEME热潮 #加密市场回调 #加密概念美股普涨


