
How to manage positions in different market conditions? Self-made position ratio (with illustrations)
I believe many people encounter a problem when trading: they do not grasp the cycles well.
For instance, I am used to trading on the one-hour chart, but when there is no profit margin on the one-hour chart, I want to look for opportunities on the five-minute chart. Jumping from a large cycle to a small cycle, I still tend to place orders according to the previous position size, which leads to a problem: small gains and large losses. Plus, I will not control the position, not knowing how much position to take each time.
Today, we will learn how to calculate position size and how to use and obtain a free calculator.
1. Transitioning trading cycles makes it easy to gain small and lose big.
Why is it that the risk-reward ratio remains the same but you earn less on a five-minute chart than on a one-hour chart?
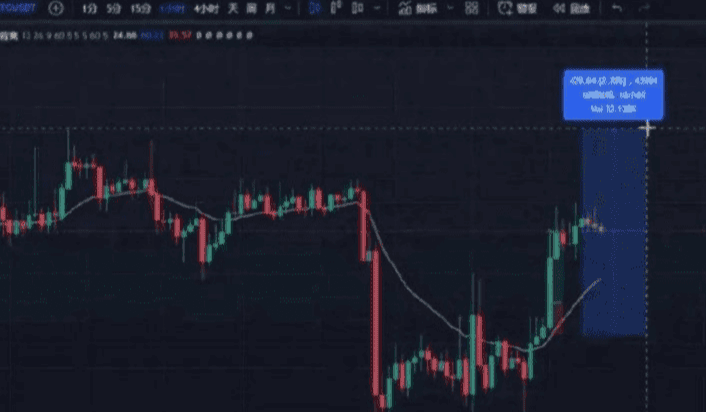
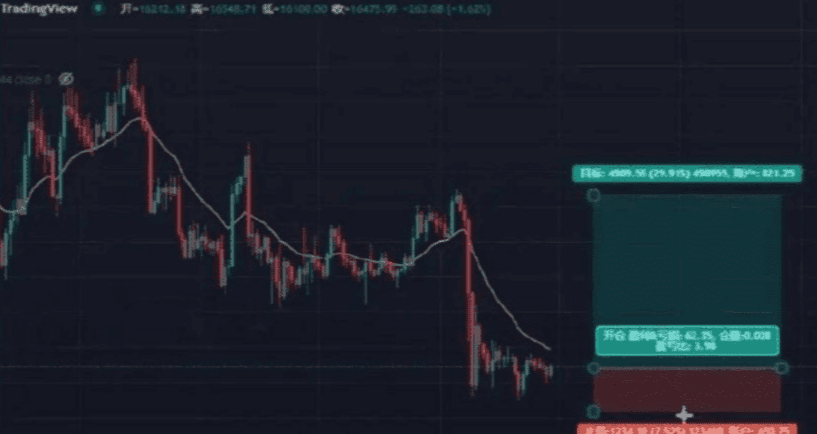
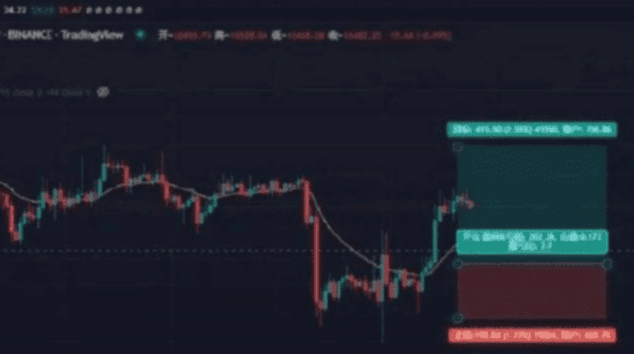
On the one-hour chart, we can roughly earn over 400 points with a 1:2 risk-reward ratio, but on the five-minute chart in Figure 2.
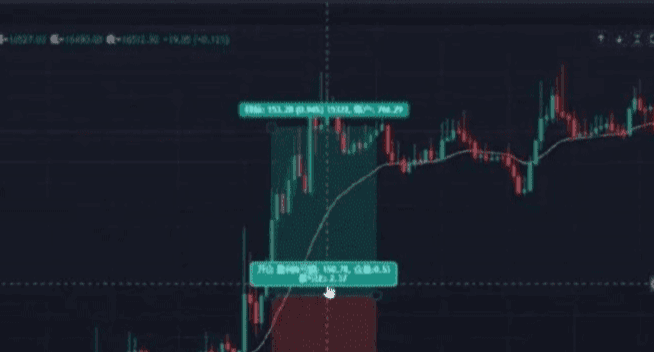
The only points we can profit from are 153. Under the same position, the money earned on the five-minute chart is different from the one-hour chart. If transitioning from the one-hour chart to the five-minute chart, you will encounter small gains and large losses.
2. Position Management
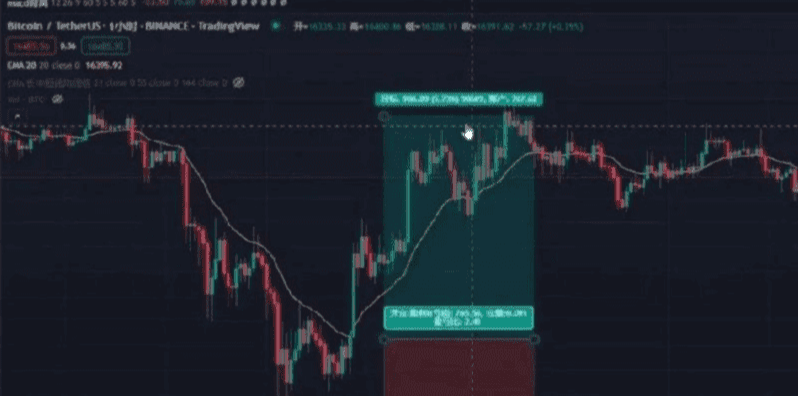
Many people know nothing about position management apart from the risk-reward ratio. For example, going long at the position in Figure 3, with a risk-reward ratio of 2.41, besides using the risk-reward ratio derived from TradingView tools, they have no other way to proceed.
Some people fully leverage their positions every time they trade, putting in as much money as they have in the account. They cannot clearly determine how much position they should take and do not know how many times to leverage. They don’t even know what position sizing based on loss means.
To make it convenient to use, I made a calculator myself, as shown in Figure 4.
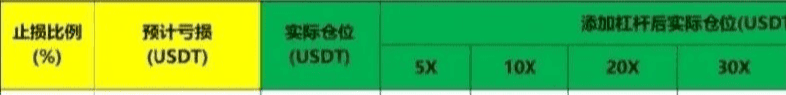
We will explain how to obtain and use this calculator later.
In fact, we profit from the volatility points in trading. If we are trading low-leverage contracts on a daily chart, failing to control the position can lead to significant losses.
The position taken on the daily chart is different from that on the one-hour chart; let's compare. Assume the maximum loss willing is $1000 each time.
Daily Chart:
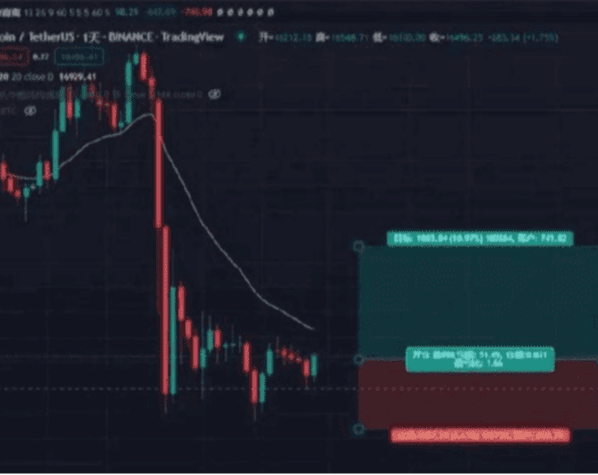
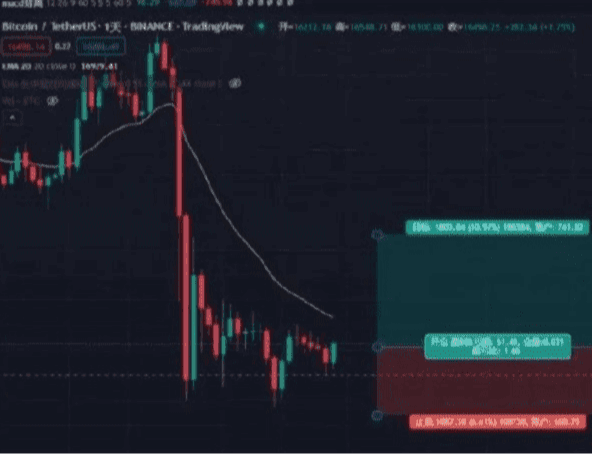
As shown in Figure 5, the stop-loss percentage on the daily chart is 7.52%, and the take-profit is nearly 30%.
One-hour Chart: The risk-reward ratio is set at 1:2 in the one-hour chart in Figure 6.
At this time, the stop-loss ratio is 1.22%, and the take-profit only needs to rise to 2.55% to take profit.
Five-Minute Chart:
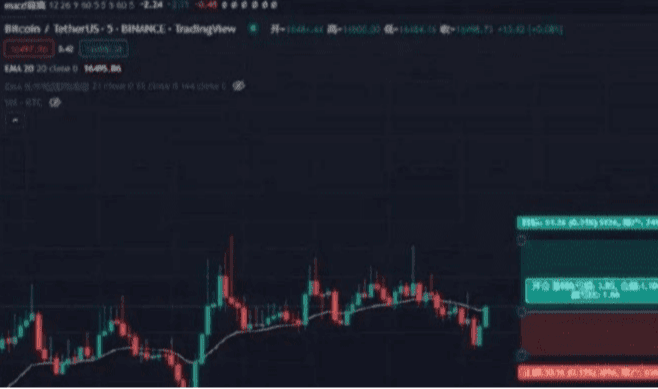
Under the same conditions, my risk-reward ratio on the five-minute chart would look like that in Figure 7.
The stop-loss is only 0.45%, and the take-profit is 1.06%.
So comparing these three cycles, do you still think you can open the same position for different cycles? Of course not. Because we profit from volatility. The risk-reward ratio for each cycle is the same, but the size of the volatility is different. Therefore, under the expectation of the same loss and gain, our position should be inversely proportional to the volatility.
3. Use and Explanation of the Calculator
To make it easier to use, I created a calculator for position size; everyone can use this calculator in Figure 8 when entering a position.
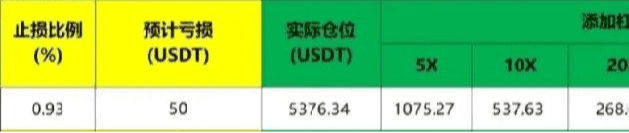
All trades must first consider how much you are willing to lose; the 'expected loss' in the calculator is the risk control ratio, and the position risk uses a fixed percentage model.
In the calculator, you only need to fill in the numbers corresponding to the yellow boxes; other numbers will automatically calculate as you input, and do not manually change any numbers other than those in the yellow boxes.
For example, if my account has $1000 and I am only willing to lose 5% each time, I would have to lose 20 times in a row to lose all my money. So, multiplying the risk ratio by the current account balance (5% * 1000) gives us the 'expected loss' amount to fill in (50).
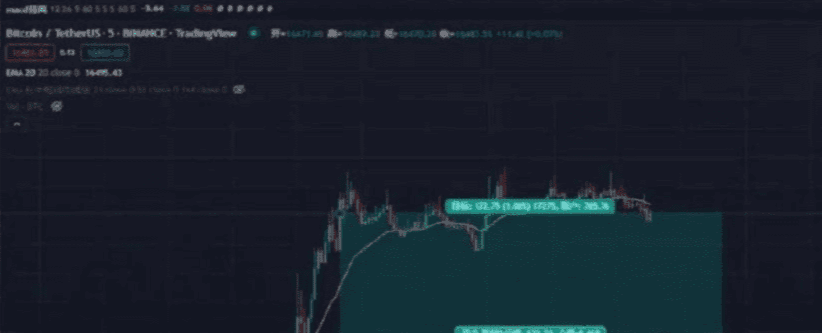
Let's first use the five-minute chart in Figure 9 as an example; now we want to enter a long position at market price.
The stop-loss ratio is 0.19, take-profit 0.31, and the risk-reward ratio is 1.66.
Fill in the stop-loss ratio of 0.19, with an expected loss of 50, then you can calculate that the actual position needs to open $26315, which corresponds to the 'actual position' number. If trading contracts with leverage, you need to look at the subsequent data; how many times to leverage depends on the corresponding numbers, but my suggestion is still to use low leverage.
So how much can we earn? The opening price and take-profit price (latest price) correspondingly, fill in the opening price of 16494 and the latest price of 16546.
That is to say, when the market rises to 51.26 (Figure 9), the expected profit from this trade is $82.96. Shorting is the opposite. Subtracting the subsequent fees gives the final actual profit.
Daily Chart:
Fill in the stop-loss ratio of 6.61, the opening price of 16444, and the latest price (take-profit price) of 18254, with the result shown in Figure 13.
Regardless of which cycle we trade, as long as we control the position well, we can guarantee the same profit and loss. Especially for beginners, do not make the positions too complicated; this calculator is sufficient.
Of course, this calculator is made for my own convenience, without considering the issue of averaging down. Our old calculator can calculate averaging down.
Wenhua only does real trading; the team still has spots available, so hurry up.
I am Wenhua, a professional analyst and teacher, a mentor and friend on your investment journey! As an analyst, the most basic task is to help everyone make money. I will help you solve confusion and stuck positions, speaking with strength. When you lose your direction and don’t know what to do, follow me, Wenhua will point you in the right direction.


